00191369-01.pdf - 第261页
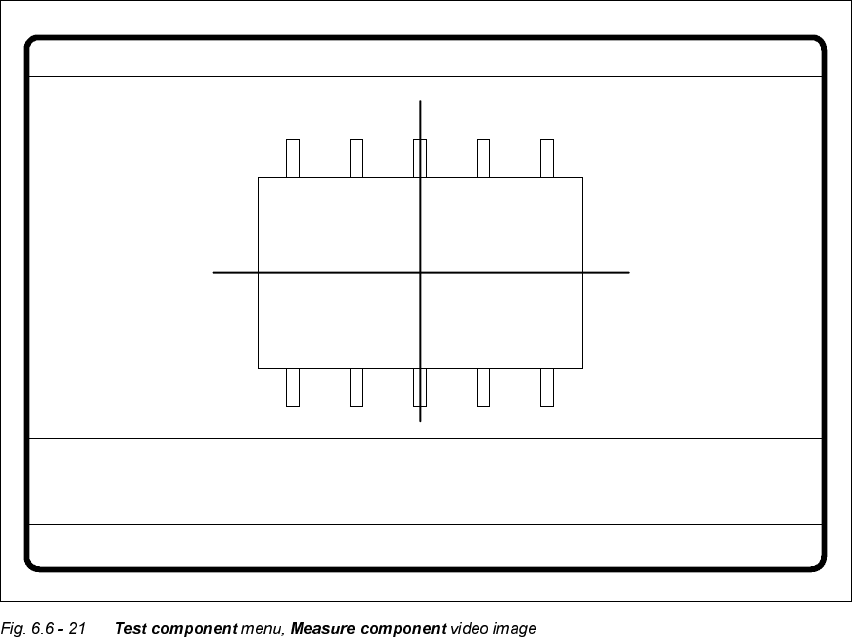
User Manual HS-50 6 Vision functions Software-Version 5.01Edition 01/99 6.6 Test Component 259 2SWL FDO VXUY H\LQJRIFRQYHQWLRQDOFRPSRQHQWV Z LWKOHDGFRQQHFW LRQV The cros shairs indicate the com ponent’s cen te…
6 Vision functions User Manual HS-50
6.6 Test Component Software-Version 5.01 Edition 01/99
258
their surfaces are wavy. The connections of these components take the form of balls with a diam-
eter of at least 80 µm. Ball-grid arrays have their connections, as the name suggests, arranged in
the form of a grid - this means that they can be described in terms of rows and columns.
With flip-chips the balls are arranged irregularly over the body of the component body. The coor-
dinates of each connection will therefore need to be ascertained individually.
The Pick & place head of the 80F
4
or 80F
5
machines pick up the BGAs or flip-chips from flatpack
magazines. However the analysis procedures used currently for conventional components are no
longer adequate for the optical centering of BGAs or flip-chips. For this reason new analysis meth-
ods and new lighting techniques have been developed for the Pick & place sensor and FC sensor
in order that this new generation of components can be centered. BGAs and flip-chips which can-
not be centered optically will be returned to the flatpack magazines by the Pick & place head.
Measure component GF No. = 5
X offset = ... Y offset = ... Phi = ...
Orthogon = ...
No. of pins = ...
Quality fact. = ...
Length[mm] = ...
Width[mm] = ...
Spacing[mm] =
RET: Measure component
P.dev.[mm] =
User Manual HS-50 6 Vision functions
Software-Version 5.01Edition 01/99 6.6 Test Component
259
2SWL FDOVXUYH\LQJRIFRQYHQWLRQDOFRPSRQHQWVZLWKOHDGFRQQHFW LRQV
The crosshairs indicate the component’s center. The component outlines are emphasized in color.
The measured values represent the geometric component parameters such as
– Lead skew
The value for lead skew will be indicated if you have selected the OHDGGULYHQ measurement
mode.
–Pitch
The value for pitch will be indicated if the FRUQHUGULYHQ measurement mode is active as the
last measurement step.
– Number of leads
– x / y offset
– Orthogonality
– Dimensions of the component
– Skew and
– Factor for the quality of measurement.
Use (VFto quit this option. The video image disappears and the 7HVWFRPSRQHQW menu is dis-
played once more on the screen.
&RORURYHUOD\VRIWKHLQGLYLGXDOPHDVXUHPHQWVWHSVGXULQJVWHSPRGH
6L]HGULYHQPRGH
See Section 6.6.4.14 on page 6 - 281 for a definition of the measuring methods.
You can recognize this measurement method by rotating windows around the component edges
Procedure:
(1) Inside the search window, profiles are created in the x and y directions. With the aid of the
gradients thus formed and a geometric filter, the approximate position of the component is
determined.
(2) Windows rotate around the component’s edges. The profile and gradients are determined for
each window. The sum of the gradients is an indication of the agreement of the window angle
with the position of the component.
If the sum of the gradients reaches a maximum, the angular position of the component has
been determined.
(3) Under the angle determined in step (2) the first step (1) is repeated. Now it will be possible
to determine the position of the component in the x and y directions more accurately.
6 Vision functions User Manual HS-50
6.6 Test Component Software-Version 5.01 Edition 01/99
260
Rectangles:
green: x and y pick-up tolerances
orange: component dimensions and tolerances supplied by the station
blue: search area for position recognition
Comments
1. The position of the component as determined must be within the green rectangle
otherwise the component will not be placed.
$SSOLHVWRDOOPHDVXUHPHQWVWHSV
2. The component must be located within the orange window. Otherwise the measurement
results will not be dependable.
3. The search areas should have the same alignment as the component and also be larger
than the component.
Lines:
red: Edges of the component detected
Comments:
The red lines may often be covered by others and thus possibly not detectable.
Overlay:
gray: Profile in the integration direction in question
blue: Gradients from the above profiles
yellow: Results from the geometric filter
red: Interpolation limits for position determination
light blue: Results of interpolation-> Position
Comments:
The results of interpolation should be found around the maximum of the geometric filter.