YG300_Ope_E.pdf - 第113页
3-27 3 Starting and ending pr oduction • [ A l l C h e c k ] b u t t o n C l i c k i n g t h i s b u t t o n s e t s " w a t c h - a n d - w a i t " m o d e f o r a l l c o m p o n e n t s w i t h a b n o r m a…
3-26
3
Starting and ending production
• Parts name
Displays the component name.
• Feeder Type
Displays the type of feeder.
• Pick Rate (%)
Displays the pickup rate for each component. Rate is calculated by the following formula.
1 – ([Error count] ÷ [Number of components used]) = Pickup rate
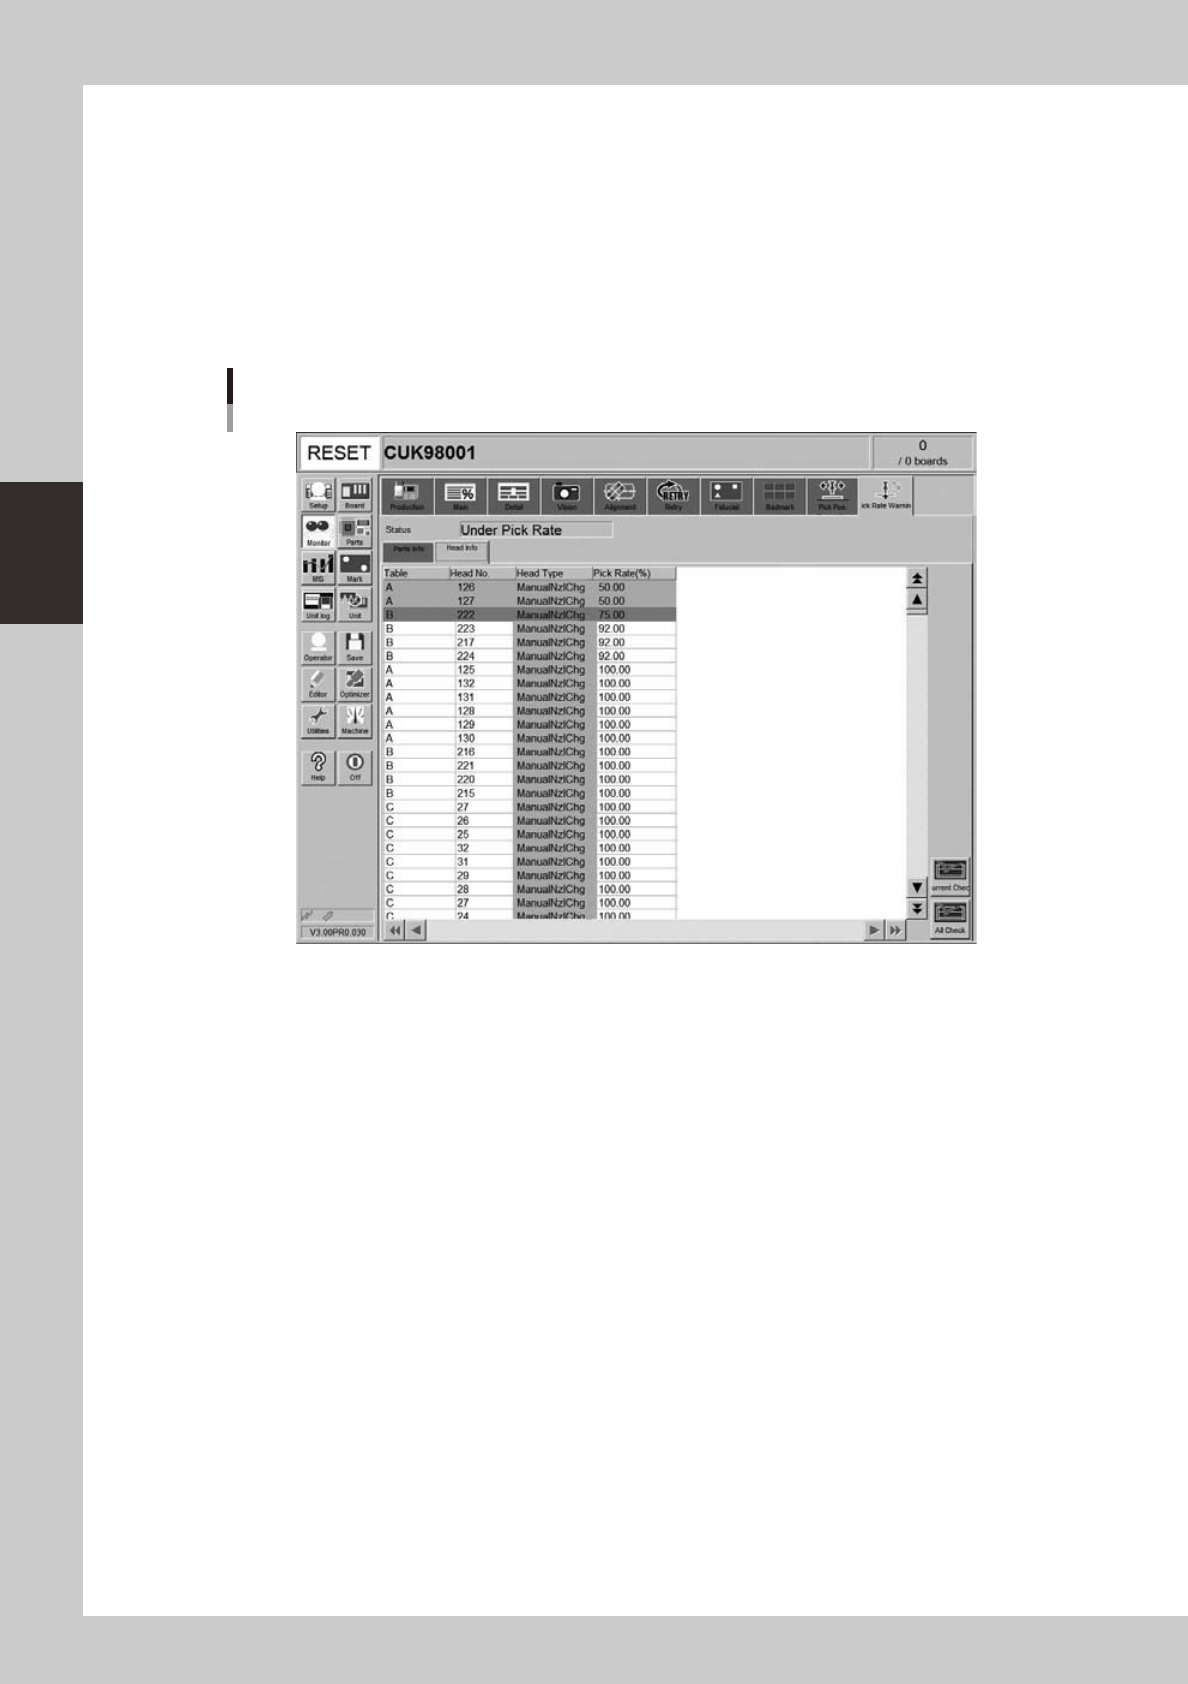
[Head Info] tab
Monitor: Pick Rate Warning
Head info
24319-M3-00
• Table
Displays the feeder table (feeder plate location).
• Head No.
Displays the head No. being used.
• Head Type
Displays the type of head being used.
• Pick Rate (%)
Displays the pickup rate for each head. Rate is calculated by the following formula.
1 – ([Error count] ÷ [Number of components used]) = Pickup rate
• [Current Check] button
Selecting a component (row) from among components with abnormal pickup rates (rows shown in "red") and clicking this
button sets "watch-and-wait" mode for that component.
3-27
3
Starting and ending production
• [All Check] button
Clicking this button sets "watch-and-wait" mode for all components with abnormal pickup rates (rows shown in "red").
n
What is
"watch-and-wait" mode?
When "watch-and-wait" mode is entered by pressing the [Current Check] or [All Check] button, the abnormal pickup rate
at that point is stored and the color of "red" row(s) changes to "pink" temporarily. If the pickup rate then improves or
deteriorates from that point onward, the color of the row(s) changes to report the new state to the operator.
For example, after an abnormal pickup rate is stored in "watch-and-wait" mode, if the problem is eliminated and
operation resumed, and the pickup rate improves, then the color of the row(s) changes from "pink" to "yellow" to show
an improvement has been made. Conversely, if the pickup rate becomes even worse, then the color changes from "pink"
back to "red" to show the troubleshooting was ineffective.
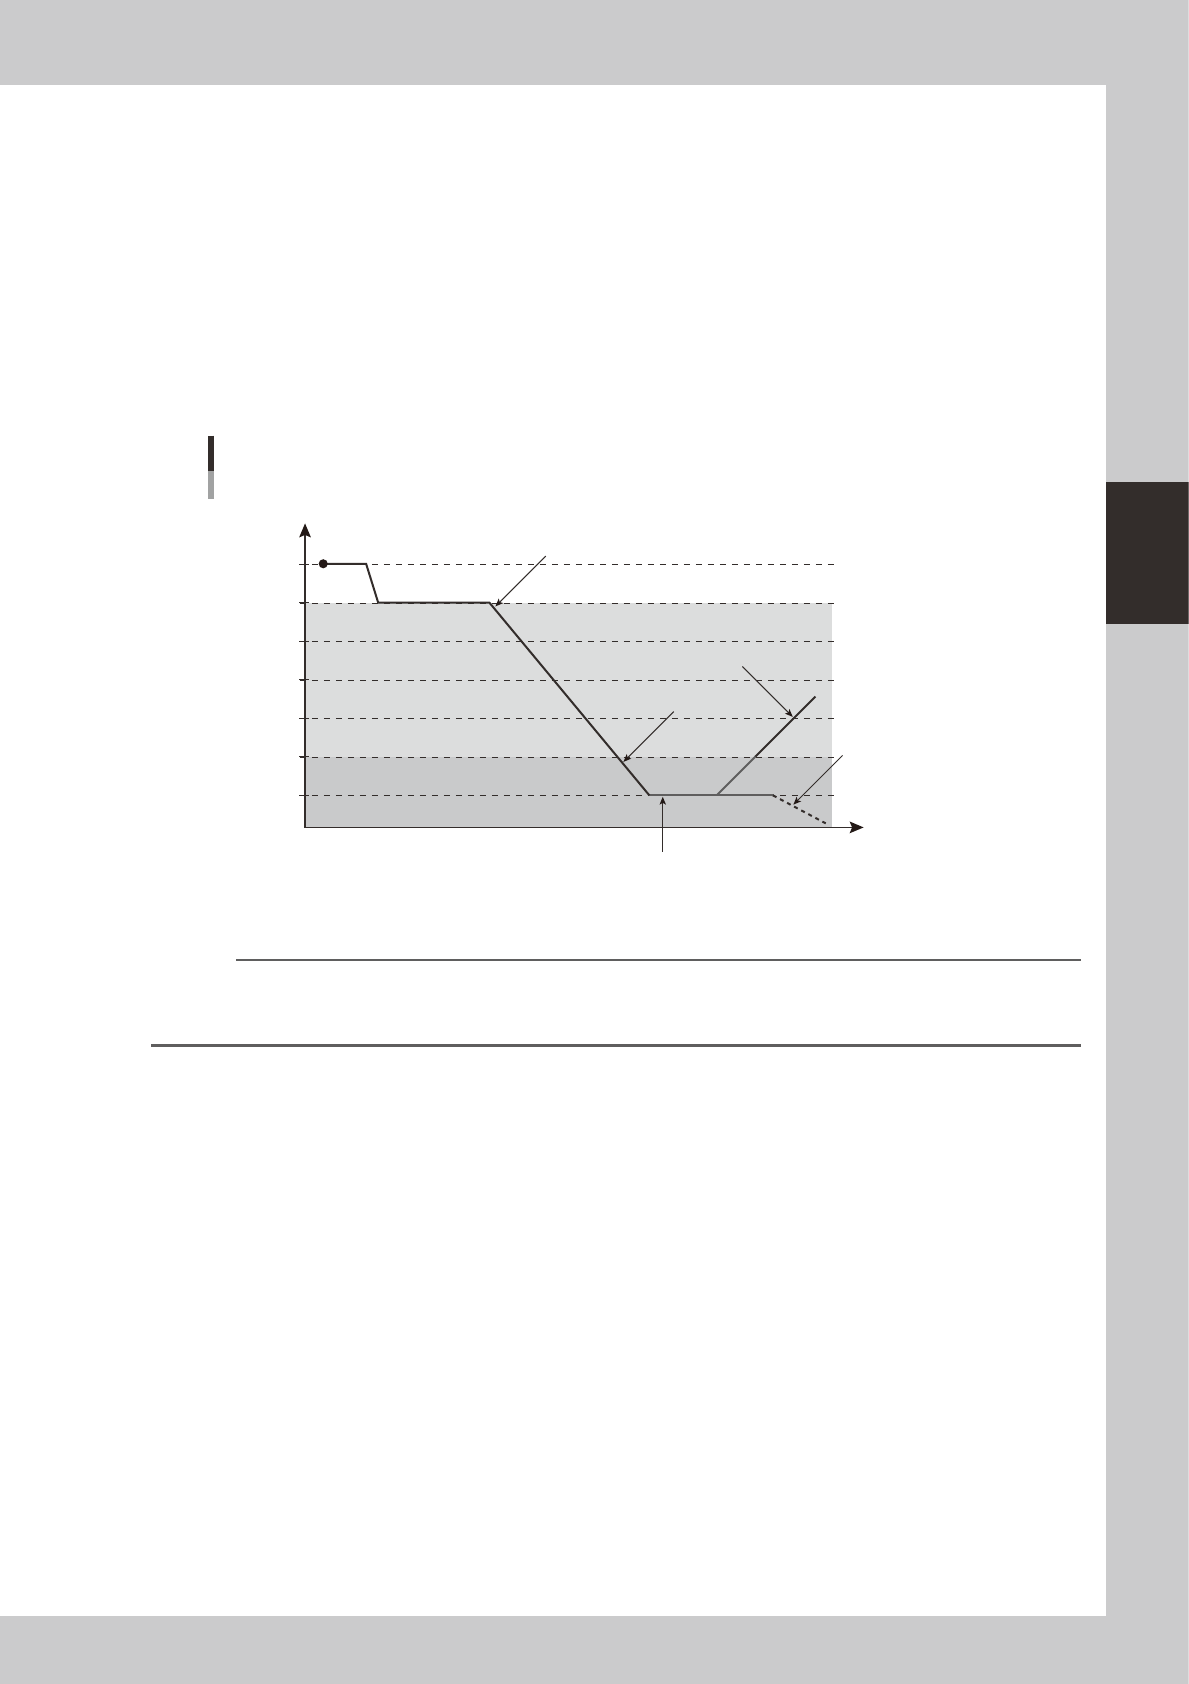
The colors in the following graph show changes in the pickup rate, using an example when "caution (yellow)" is set to
99.00% and "warning (red)" to 95.00%.
Color transitions per changes in pickup rates
100
99
98
97
96
95
94
Pickup rate %
Time
Changes to yellowStart (white)
Changes to yellow (better pickup rate)
Changes to red
Changes to red
(worse pickup rate)
Pressing the [Current Check] or [All Check] button enables
"watch-and-wait" mode and changes the color of "red" row(s) to
"pink".
23303-M0-00
Reference
When "watch-and-wait" mode is enabled, the color of the "red" row(s) showing an abnormal pickup rate changes to
"pink" and the pickup rate at that point is stored. The "pink" color then changes according to changes in the pickup
rate from that point onward.