YG300_Ope_E.pdf - 第98页
3-12 3 Starting and ending pr oduction 5 . Op e r a t i n g N a v i g a t i o n a r e a ( o p e r a t i n g i n s t r u c t i o n m e s s a g e a r e a ) • S e l e c t O p e r a t i n g P o s i t i o n d r o p - d o w n …
3-11
3
Starting and ending production
4. Displaying the production monitors
Press the [Monitor] button to confirm the operation status during production.
The mounting information can be confirmed by selecting the [Main], [Detail], [Vision], [Alignment] and [Retry]
tabs.
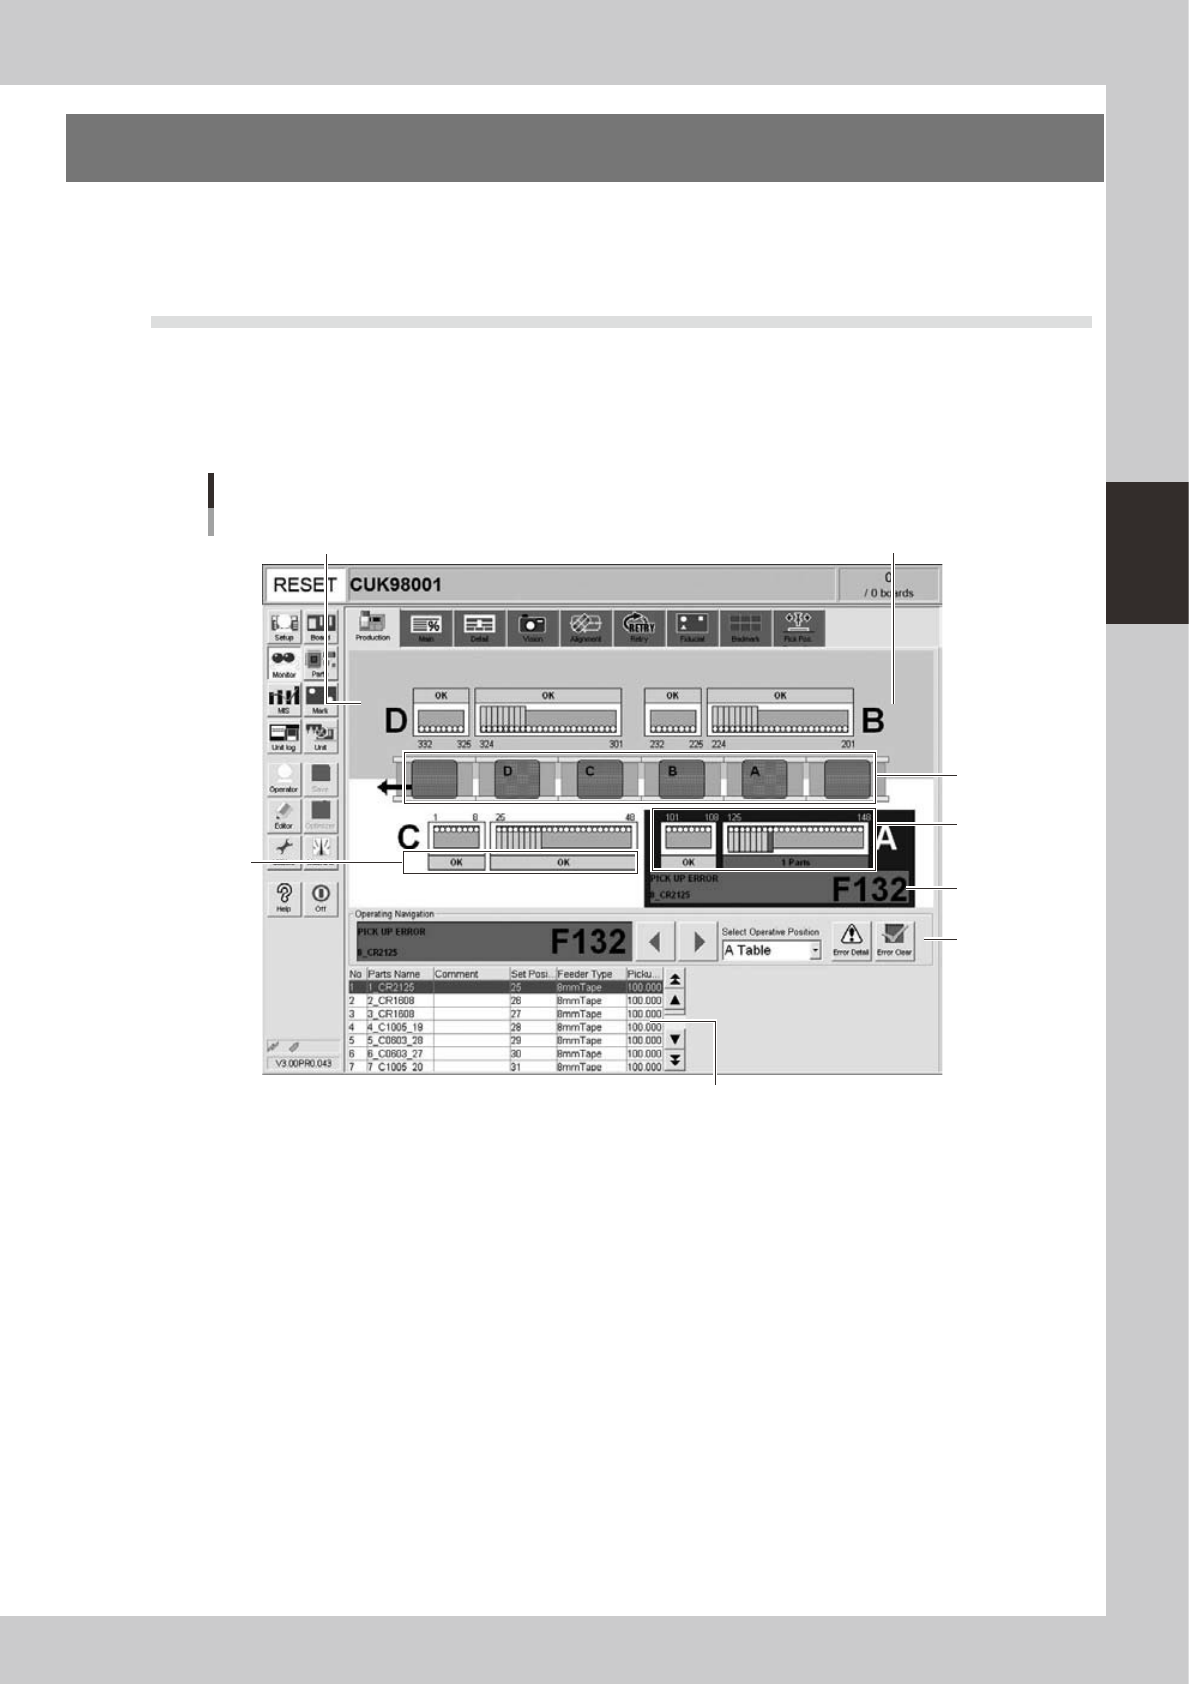
4.1 Production
This screen shows the status of machines currently producing boards. Real-time information is displayed on the
machine layout view as shown below. When an error occurs on the machine, open this screen to check status
information such as what type of error occurred, operating instructions, and warnings, etc. Error locations are
grouped into placement tables, feeders and conveyor units. Locations with errors are shown on the machine
layout view in different colors to make the error location easy to find.
Monitor: Production
1
2
4
3
5
6
Shows component placement tables.Shows the machine rear as a colored background
24309/-M3-00
1. Transfer status area
Displays the status of a stage where an error, operating instruction, or warning involving board transfer was issued.
When a hazard sensor is activated, the board where the error has occurred appears in semi-transparent red on the screen.
When the sensor in the board clamp position or board standby position is activated, the board in the board clamp
position or board standby position appears in semi-transparent green on the screen.
2. Feeder status area
Displays the feeder at the feeder set position where parts are registered, by referencing "Parts" - "Feeder Set No." of the
board data currently used for board production. Nothing is displayed at feeder set positions where no parts are registered.
3. Feeder plate status area
Displays "OK" when there are no errors, operating instructions or warnings for the feeders currently in use.
Displays "n Parts" ("n" is the number of feeders) when errors, operating instructions or warnings were issued for the
feeders currently in use.
4. Placement table status area
This area displays the status on each placement table. If an error, operating instruction or warning has occurred on a
placement table, the status of that table is displayed in this area.
If multiple errors, operating instructions or warnings have occurred on the same placement table, then the highest
priority item is displayed.
Nothing appears unless operating instructions or warnings were issued.

3-12
3
Starting and ending production
5. Operating Navigation area (operating instruction message area)
• Select Operating Position drop-down list
When an error, operating instruction or warning occurs, select the position showing an error from this drop-down list.
Only positions requiring an operator task are displayed in the drop-down list.
Reference
You can select the operating position by clicking the error area on the layout view. However the operating position
cannot be selected if you click on an area where there are no errors, operating instructions or warnings.
• Operating Navigation instructions
This displays messages with countermeasures for handling errors, operating instructions or warnings at operating position
selected with the "Select Operating Position" drop-down list. When multiple errors occur, those items with the highest
priority for countermeasures are displayed in sequence. To switch to other instruction messages, press the left/right arrow
buttons.
[Error Detail] button
Pressing this button displays an error message dialog that contains detailed information and countermeasures for the
error and operating instruction, or warning displayed in the "Operating Navigation" area.
[Error Clear] button
Press this button after recovering from the error or after handling the operating instruction or warning displayed in the
"Operating Navigation" area. Pressing this button shows that recovery is complete by following the message in the
"Operating Navigation" area, and that automatic operation can restart.
However, automatic operation will not restart if a recovery task is still incomplete (other than warnings).
6. Component information display area
Displays basic information on components currently being used in the program (board data) for production. Data that is
causing an error appears in a different color.
Reference
If an error has occurred on the entire machine then the entire area background is displayed in blue.
3-13
3
Starting and ending production
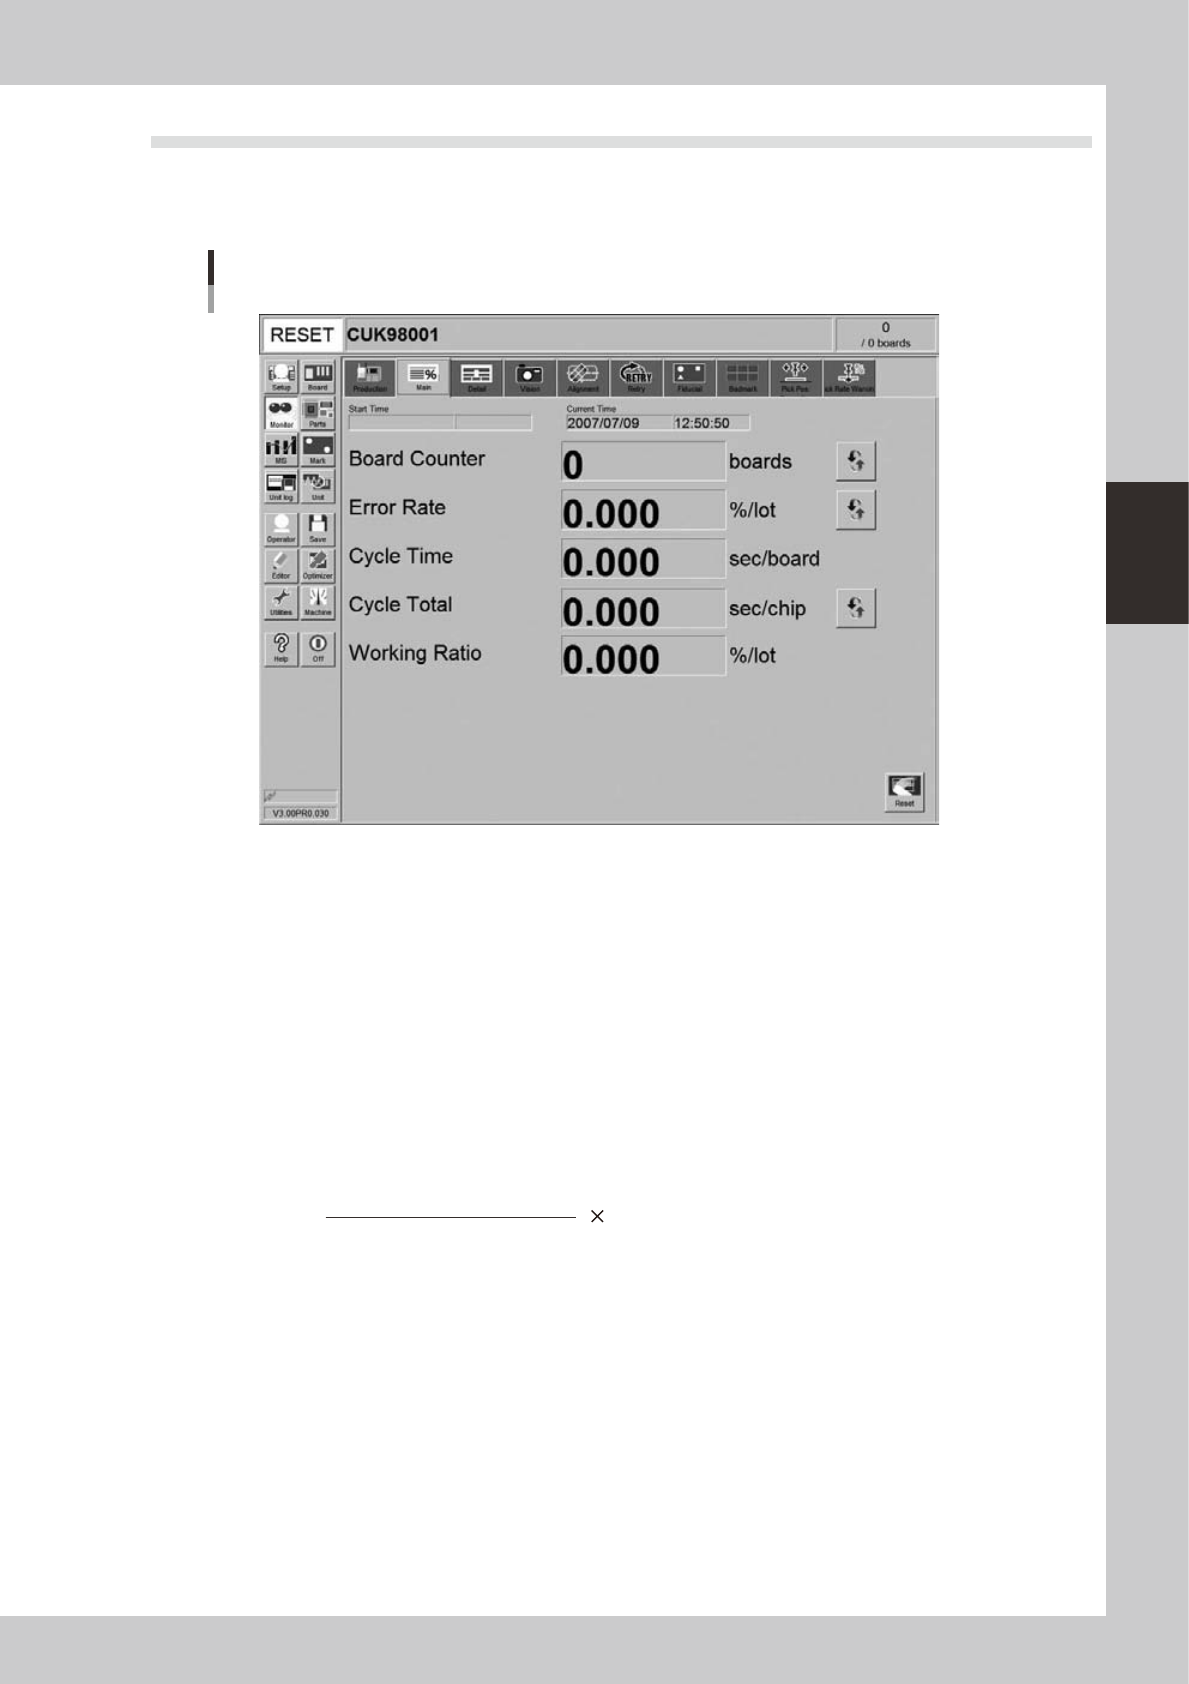
4.2 Main
The [Monitor]-[Main] tab screen shows you the real-time production status such as the board count and cycle
time. Displaying this screen during production is handy. All information will be cleared when the board type is
changed.
Monitor: Main
24310-M3-00
• Start Time
Displays the date and time that the board data currently being produced was changed.
• Current Time
Displays the current date and time (system clock time in the machine).
• Board Counter
Displays the number of boards produced after changing to the current board data. The board data that was reset before
component mounting is complete is not counted unless the component mounting is resumed and completed.
• Error Rate
Displays the rate of discarded components due to pickup or recognition errors with respect to all components that have
been consumed after changing to the current production board data. This data is updated when the production of one
board is completed.
Number of discarded components
Total component consumption
Error rate (%) =
100
• Cycle Time (sec/board)
Shows the average (seconds/board) of the mounting time per board. The data is updated when component mounting on
each board is completed. The cycle time includes the mark (including fiducial and bad marks) recognition time,
component pickup time, component recognition time, mounting time, retry operation time, component dump time and
nozzle change time.
The board transfer time and stop time (time stopped with error or [STOP] button) is not included.
• Cycle Total (sec/chip)
Shows the time (seconds) to mount one component on the board. This is the time obtained by dividing the time for one
sequence from pickup to mounting by the number of components mounted in that sequence.