1OPERATION_.pdf - 第235页
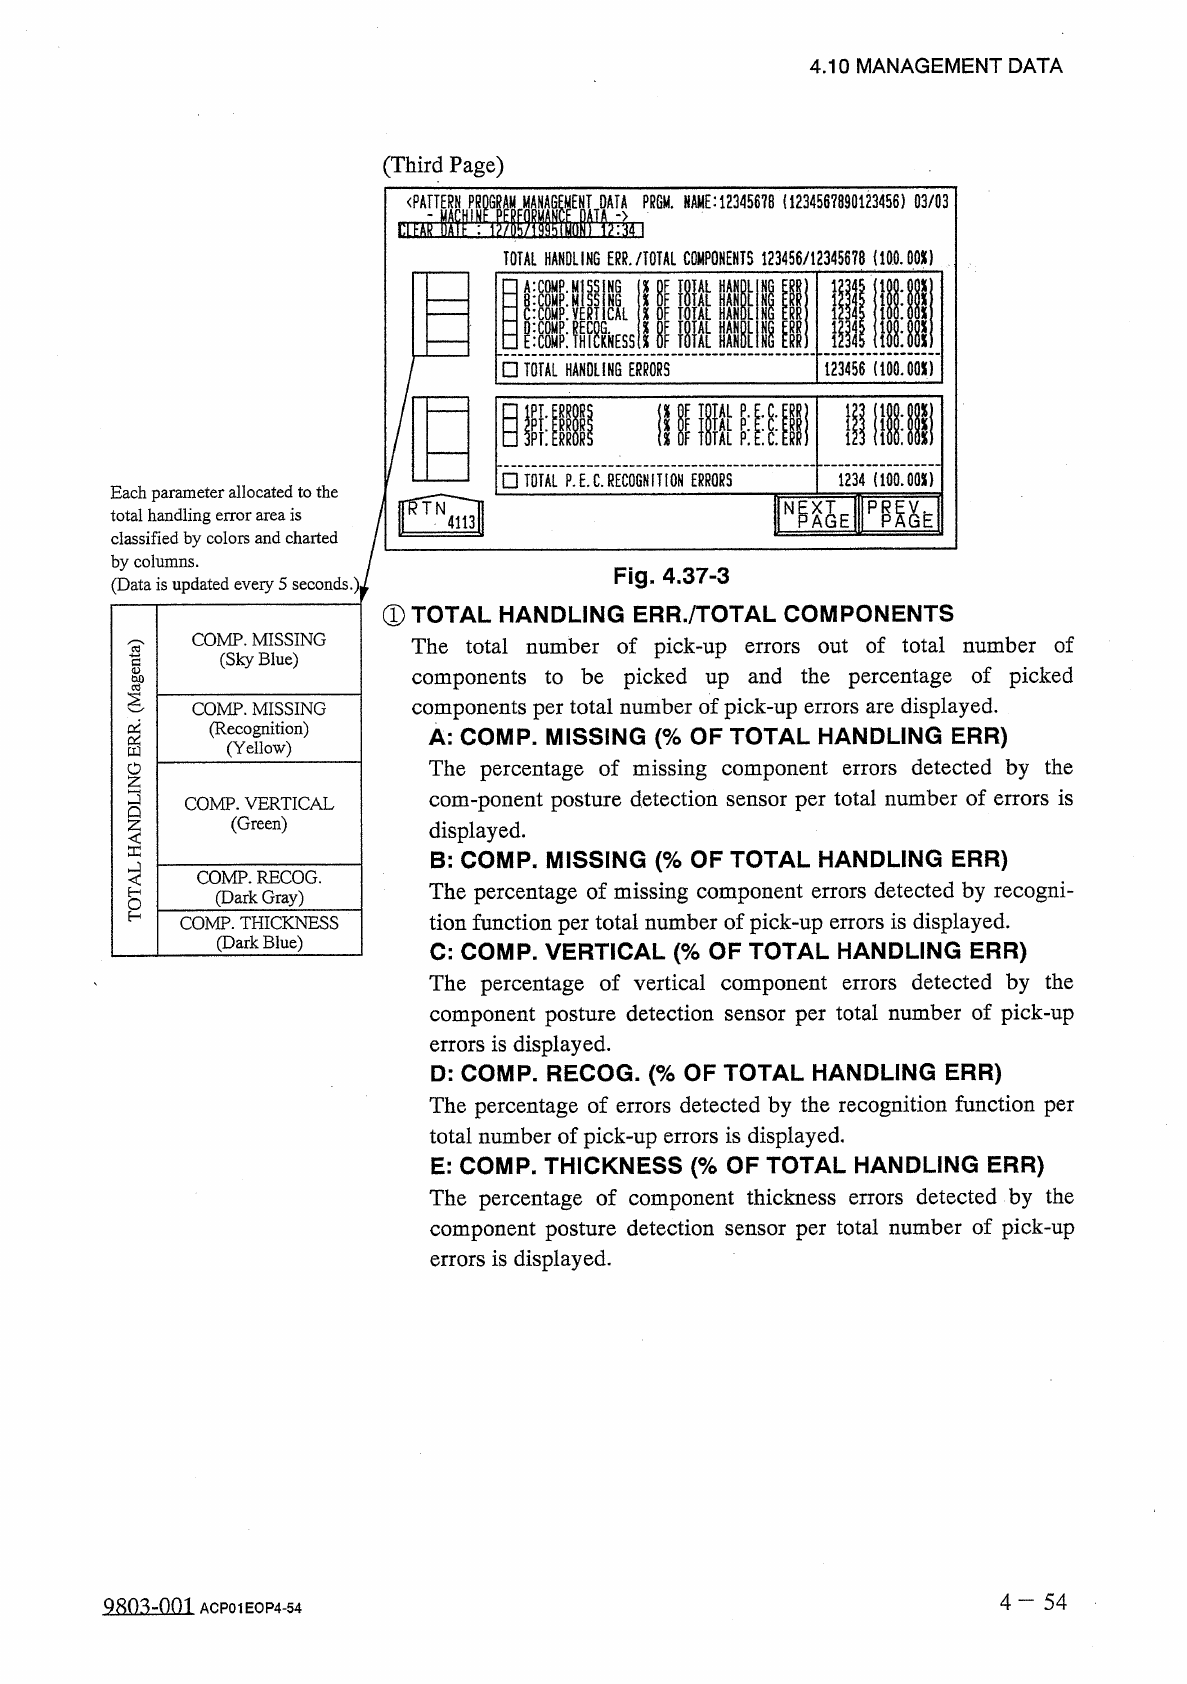
123456 ( lOO . OQX ) □ TOTAL HANDLING ERRORS illl 111 1234 { lOO . OQX ) □ TOTAL P . E . C . RECOGNITION ERRORS 既 E N Fig . 4.37 - 3 ① TOTAL HANDLING ERR . / TOTAL COMPONENTS out of total number of The total number of pi…
4.10
MANAGEMENT
DATA
P
.
C
.
B
.
WAIT
INPUT
WAIT
:
The
time
measured
when
the
machine
is
completely
in
the
waiting
mode
(
the
machine
is
waiting
for
a
P
.
C
.
B
.
to
be
loaded
from
the
input
machine
)
is
summed
up
.
OUTPUT
WAIT
:
The
time
measured
when
the
machine
is
completely
in
the
waiting
mode
(
the
machine
is
waiting
for
a
P
.
C
.
B
.
to
be
unloaded
to
the
output
machine
)
is
summed
up
.
OTHERS
(
Automatic
Operation
)
:
Time
required
for
bad
mark
detection
,
P
.
C
.
B
.
transfer
,
pick
-
up
actions
before
the
first
component
placement
,
etc
.
,
is
summed
up
.
③
STOP
TIME
:
Time
when
component
placement
operation
is
interrupted
for
component
replenishment
,
etc
.
,
is
summed
up
.
ERROR
STOP
ERROR
ALARM
:
Time
when
an
alarm
(
tower
lamp
ON
)
is
issued
is
summed
up
.
RECOVERY
:
Time
between
error
cancellation
and
restart
of
machine
operation
is
summed
up
.
FEEDER
RELOAD
:
Time
required
for
component
replenishment
is
summed
up
.
OTHERS
(
Stop
)
:
Time
required
for
set
-
up
,
program
change
,
idling
operations
,
etc
.
,
is
summed
up
.
④
SET
UP
TIME
:
Time
when
the
[
OPERATION
]
switch
is
set
in
the
“
SET
UP
:
mode
.
⑤
TEST
MODE
TIME
:
Time
when
te
;
parameters
)
is
s
is
performed
(
according
to
the
test
mode
st
run
]
summed
up
.
4
~
53
QRn
^
-
nm
ACP
01
EOP
4
-
53
123456
(
lOO
.
OQX
)
□
TOTAL
HANDLING
ERRORS
illl
111
1234
{
lOO
.
OQX
)
□
TOTAL
P
.
E
.
C
.
RECOGNITION
ERRORS
既
E
N
Fig
.
4.37
-
3
①
TOTAL
HANDLING
ERR
.
/
TOTAL
COMPONENTS
out
of
total
number
of
The
total
number
of
pick
-
up
components
to
be
picked
up
and
the
percentage
of
picked
errors
components
per
total
number
of
pick
-
up
errors
are
displayed
.
A
:
COMP
.
MISSING
(
%
OF
TOTAL
HANDLING
ERR
)
detected
by
the
The
percentage
of
missing
component
com
-
ponent
posture
detection
sensor
per
total
number
of
errors
is
errors
displayed
.
B
:
COMP
.
MISSING
(
%
OF
TOTAL
HANDLING
ERR
)
The
percentage
of
missing
component
errors
detected
by
recogni
-
tion
function
per
total
number
of
pick
-
up
errors
is
displayed
.
C
:
COMP
.
VERTICAL
(
%
OF
TOTAL
HANDLING
ERR
)
detected
by
the
The
percentage
of
vertical
component
component
posture
detection
sensor
per
total
number
of
pick
-
up
errors
is
displayed
.
errors
D
:
COMP
.
RECOG
.
(
%
OF
TOTAL
HANDLING
ERR
)
The
percentage
of
errors
detected
by
the
recognition
function
per
total
number
of
pick
-
up
errors
is
displayed
,
E
:
COMP
.
THICKNESS
(
%
OF
TOTAL
HANDLING
ERR
)
The
percentage
of
component
thickness
errors
detected
by
the
component
posture
detection
sensor
per
total
number
of
pick
-
up
errors
is
displayed
.
4
—
5 4
4.10
MANAGEMENT
DATA
(
Third
Page
)
<
PArTERNHPRgGR
^
FMANAG
^
ENITDATA
PRGM
.
NAME
:
12345678
(
1234567890123456
)
03
/
03
HE
E
TOTAL
HANDLING
ERR
.
/
TOTAL
COMPONENTS
123456
/
12345678
(
100.00
*
)
Each
parameter
allocated
to
the
total
handling
classified
by
colors
and
charted
by
columns
.
(
Data
is
updated
every
5
seconds
.
)
is
error
area
Q
80
^
-
nm
ACP
01
EOP
4
-
54
COMP
.
MISSING
(
Sky
Blue
)
COMP
.
MISSING
(
Recognition
)
(
Yellow
)
COMP
.
VERTICAL
(
Green
)
COMP
.
RECOG
.
(
Dark
Gray
)
COMP
.
THICKNESS
(
Dark
Blue
)
AMXMXUOO
|
J
-
-
*
.
»
I
RRRRRR
g
—
LLLLL
AAAAA
TTI
T
nxuonuo
U
.
t
r
nwo
onuftu
L
OMOMOMOMOM
ccccc
cc
SU
3
SBS
)
.
HHpaoznazVH
Jvlol
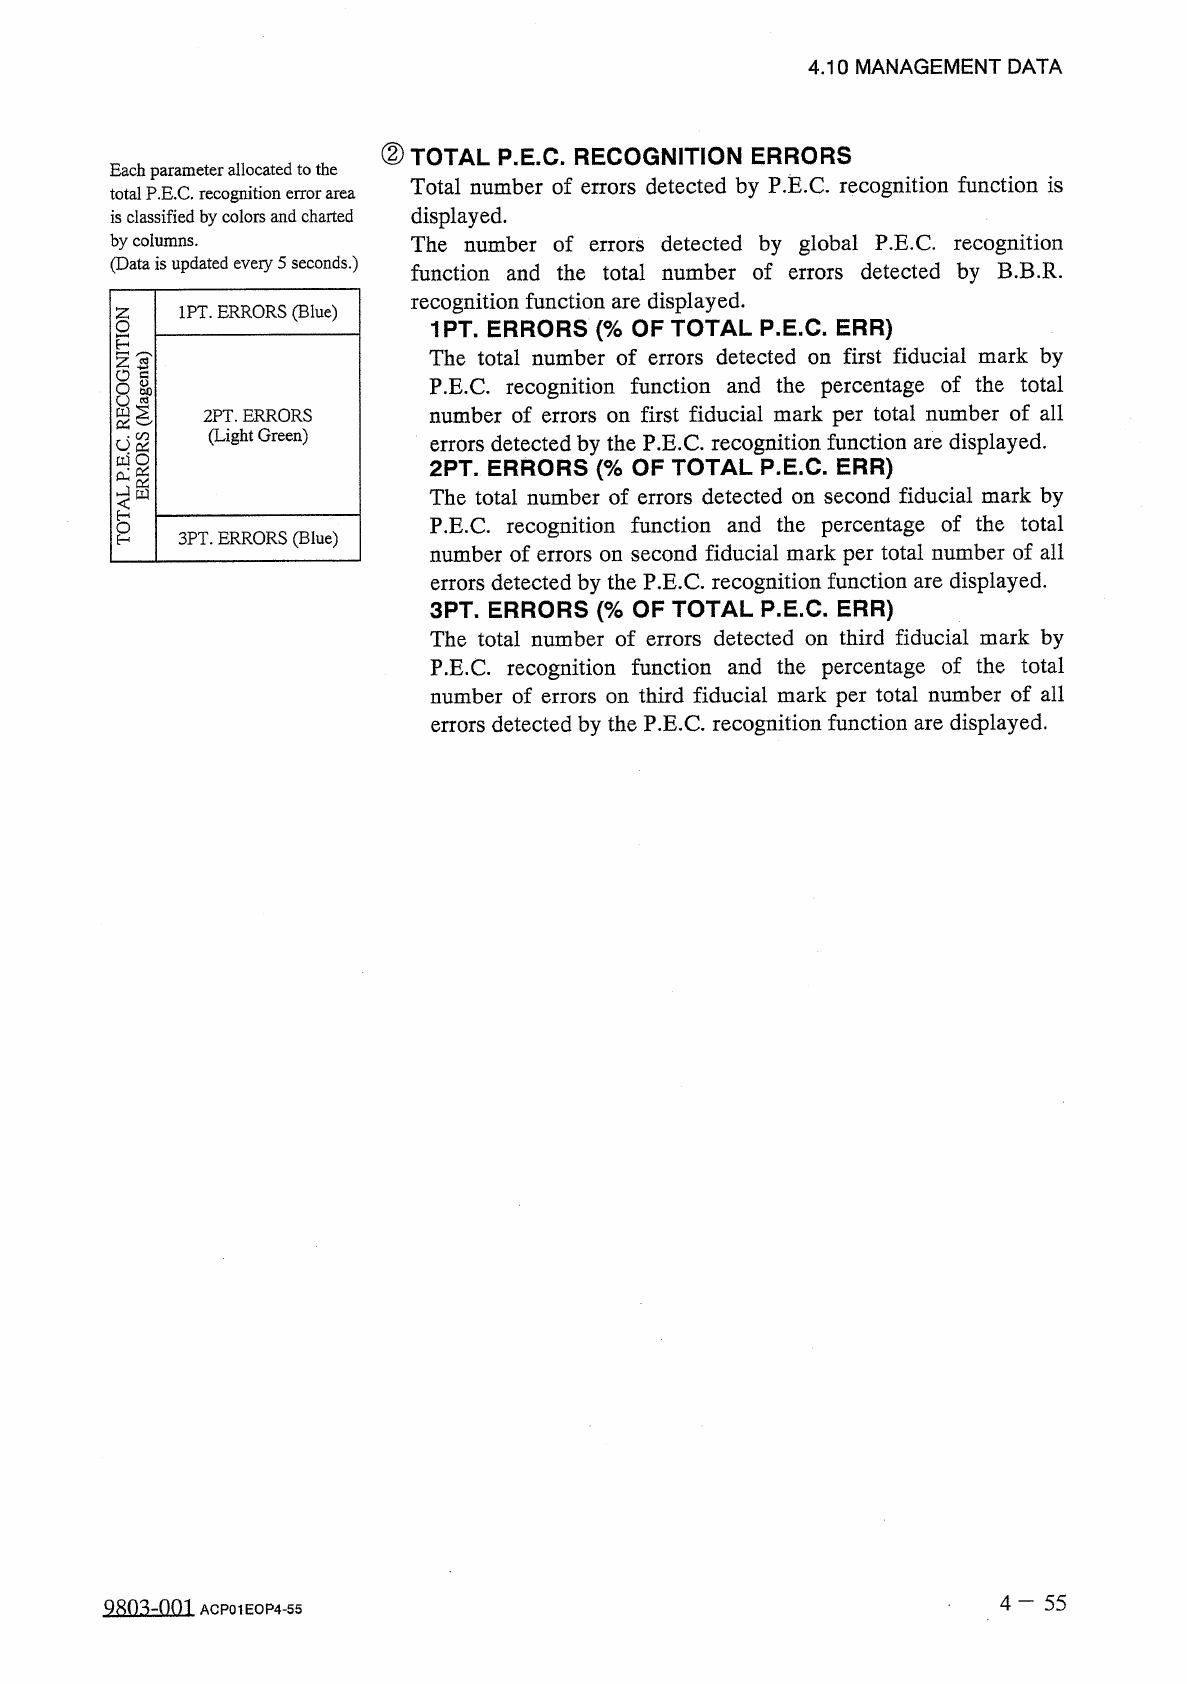
1
PT
.
ERRORS
(
Blue
)
2
PT
.
ERRORS
(
Light
Green
)
3
PT
.
ERRORS
(
Blue
)
4.10
MANAGEMENT
DATA
②
TOTAL
P
.
E
.
C
.
RECOGNITION
ERRORS
Total
number
of
errors
detected
by
P
.
E
.
C
.
recognition
function
is
displayed
.
The
number
of
errors
detected
by
global
P
.
E
.
C
.
recognition
function
and
the
total
number
of
errors
detected
by
B
.
B
.
R
.
recognition
function
are
displayed
.
1
PT
.
ERRORS
(
%
OF
TOTAL
P
.
E
.
C
.
ERR
)
The
total
number
of
errors
detected
on
first
fiducial
mark
by
P
.
E
.
C
.
recognition
function
and
the
percentage
of
the
total
number
of
errors
on
first
fiducial
mark
per
total
number
of
all
errors
detected
by
the
P
.
E
.
C
.
recognition
function
are
displayed
.
2
PT
.
ERRORS
(
%
OF
TOTAL
P
.
E
.
C
.
ERR
)
The
total
number
of
errors
detected
on
second
fiducial
mark
by
P
.
E
.
C
recognition
function
and
the
percentage
of
the
total
number
of
errors
on
second
fiducial
mark
per
total
number
of
all
errors
detected
by
the
P
.
E
.
C
.
recognition
function
are
displayed
.
3
PT
.
ERRORS
(
%
OF
TOTAL
P
.
E
.
C
.
ERR
)
The
total
number
of
errors
detected
on
third
fiducial
mark
by
P
.
E
.
C
.
recognition
function
and
the
percentage
of
the
total
number
of
errors
on
third
fiducial
mark
per
total
number
of
all
errors
detected
by
the
P
.
E
.
C
recognition
function
are
displayed
.
Each
parameter
allocated
to
the
total
P
.
E
.
C
.
recognition
error
area
is
classified
by
colors
and
charted
by
columns
.
(
Data
is
updated
eveiy
5
seconds
.
)
4
-
5 5
asoizOQi
ACP
01
EOP
4
-
55
(
B
-
S
&
BS
)
SHCmcds
Nougooomcotadvlol