3_AVS-V2_MCT-UM-internal_EN_07-2019.pdf - 第122页
ASM AVS - U SER M ANUAL P AGE 122 OF 182 h. F req uency Ch art (G auss ’ bel l c urv e): Show s t he r esul t of the sele cte d me asurem ent de pendin g o n the Fil ter sett ing s abo ve. Wit h t he vie w o f » Freq uen…
ASM AVS - USER MANUAL
PAGE 121 OF 182
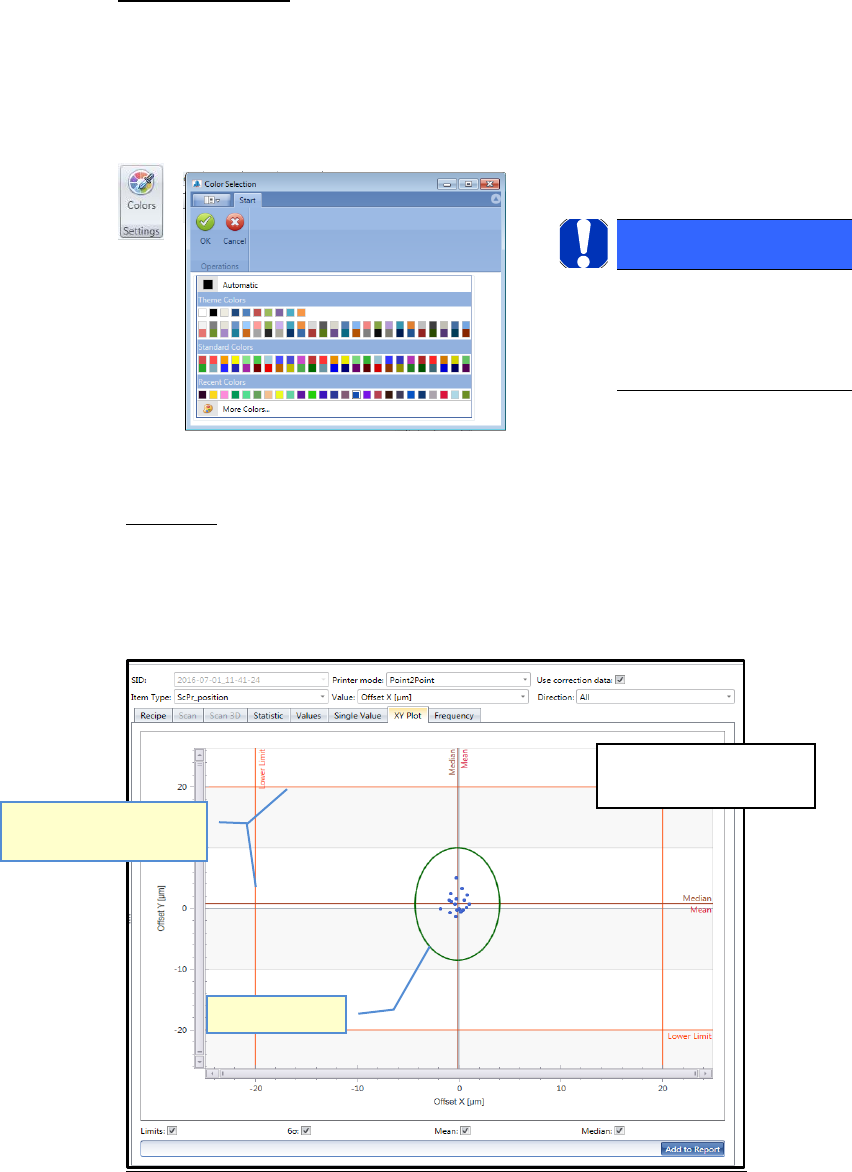
On the bottom of the chart, you can activate or deactivate all the evaluation lines.
- If you want to see either X-Offset values or Y-Offset values is organized by the filter set-
tings on top of the graph.
But if you want to see both, X- and Y- Offsets in one picture, you need to activate the
checkbox “X & Y” on the bottom of the graph.
The Y-Offset then is always shown in the same color, but in dashed line.
Set color of graph:
The color for the graph is normally set automatically for each measurement.
But you can change the color for each measurement.
Highlight the line of the corresponding measurement in the table and press “Colors” in the
menue bar.
g. X-/Y-Plot:
Shows the result of the selected measurement depending on the Filter settings above.
This view shows the result of X- and Y-axis together in one graph.
The same principles apply for evaluating the chart and in respect of the meanings of the
auxiliary lines as for the "Single Value Chart".
HINWEIS / NOTICE
After changing the color you
need to refresh the view, e.g.
by changing to the Recipe tab
and back to Analysis.
Sigma limit
Specification limits (Nom-
inal value), red lines
The Sigma Limit is shown
in a circle (ellipsis).
ASM AVS - USER MANUAL
PAGE 122 OF 182
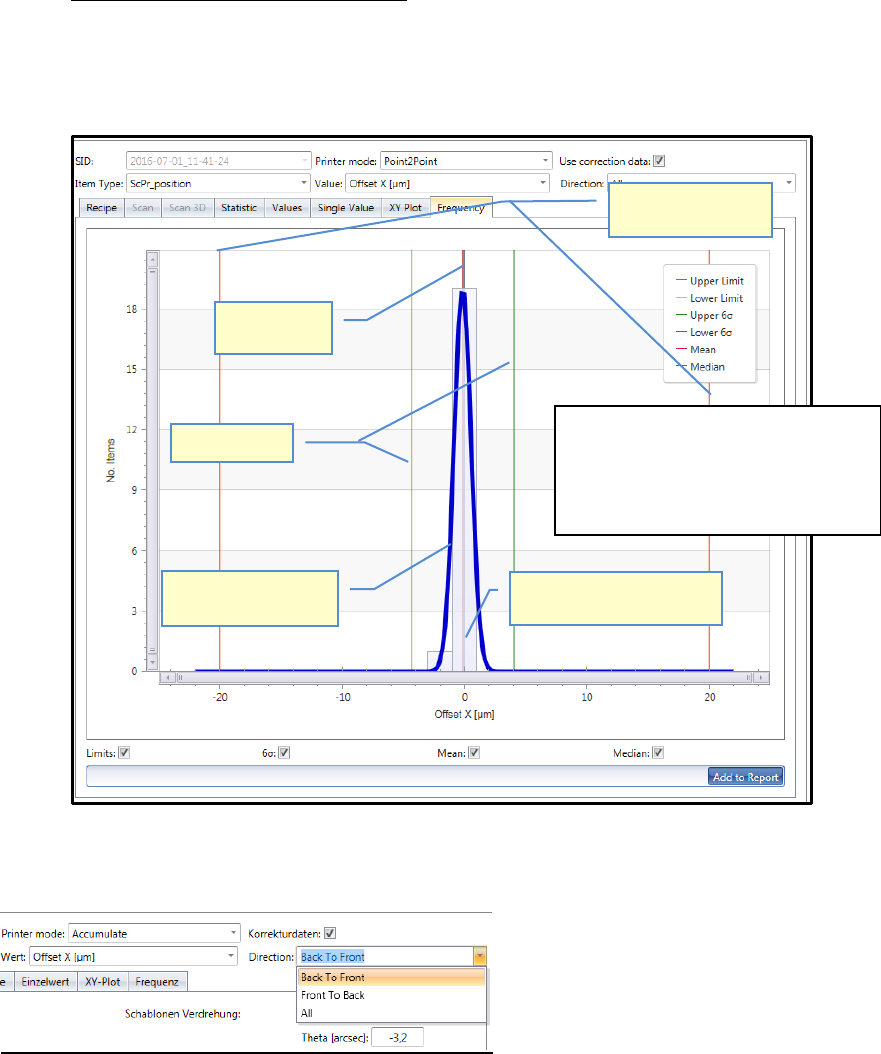
h. Frequency Chart (Gauss’ bell curve):
Shows the result of the selected measurement depending on the Filter settings above.
With the view of »Frequency« the »bell-shaped curve« (normal distribution) can be
shown (Gauss). The same principles apply for evaluating the chart and in respect of the
meanings of the auxiliary lines as for the "Single Value Chart".
7. Printing direction:
At placement machines, more different heads can be measured with one project and the heads
are assigned to groups.
These groups are allocated to the printing directions at printer projects. This makes it possible, in
each evaluation with more than one measurement activated, to filter the result according the
printing direction.
Sigma limits
Bell-shaped curve
(Normal distribution)
Specification limits
(Nominal value)
Numbers measuring points
(here in 4µm steps)
Mean value
(Mean)
As a fundamental principle:
• The narrower and higher the bell curve,
the better the result.
• The curve should ideally be centered
arround zero.
ASM AVS - USER MANUAL
PAGE 123 OF 182
5.3 »AVS_Scan« (measuring software)
5.3.1 »Current Project« and structure of »AVS_Scan«
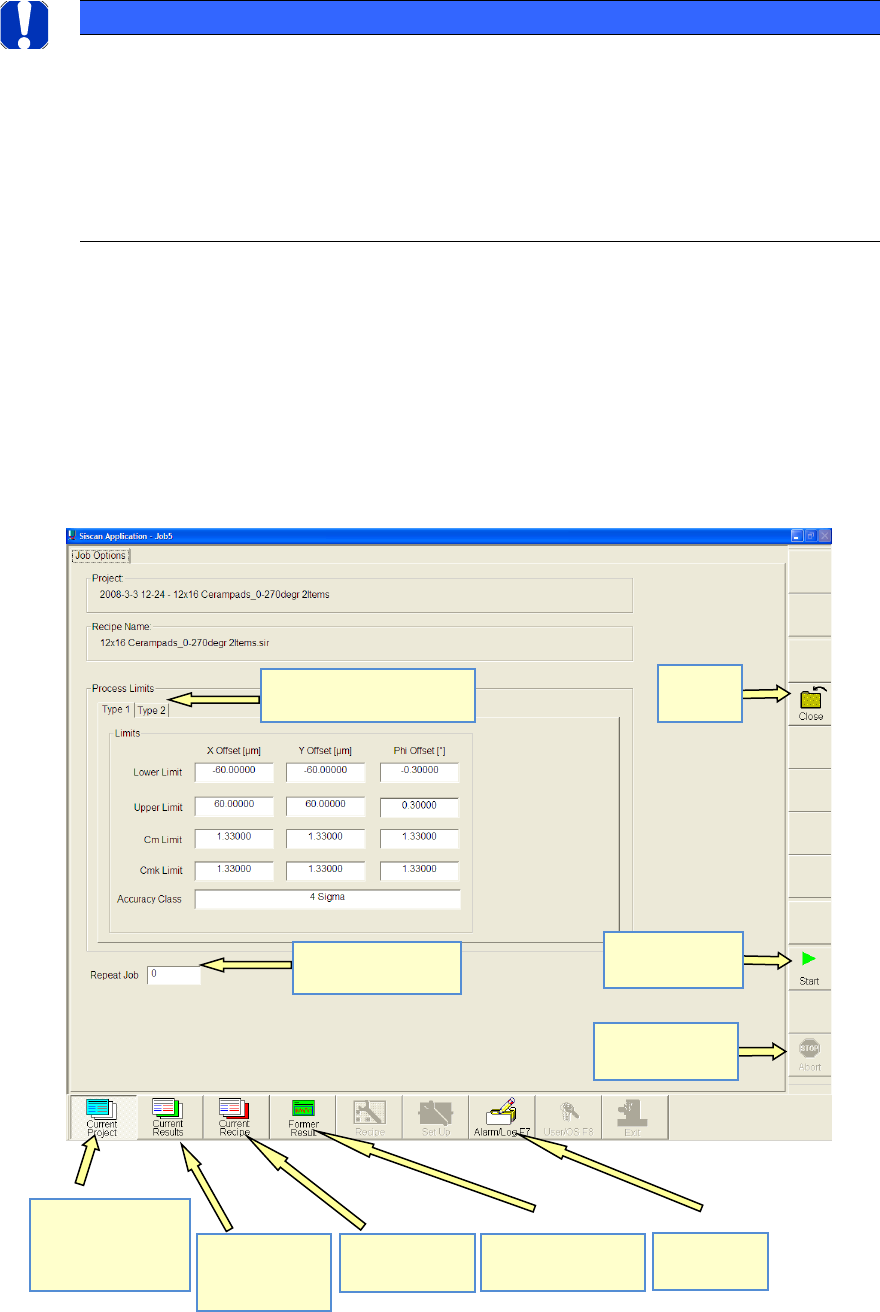
After switching to the measurement software, you see the following view.
This page displays not only the project name and recipe name but also the process limits (speci-
fication limits).
There is a separate specification for each component (item).
You can also specify the number of times the measurement is to be repeated.
NOTICE
Meaning of AVS_Scan Software
With the Software ASM AVS 4.x the calculations and reports are carried out in the ASM AVS part.
The AVS_Scan Software (previously SiScanApplication) is only used for the measuring.
But the chapter from the AVS_Scan Software keeps being part of this document in the full version.
The AVS_Scan software can always be used after forwarding a project or a recipe from the ASM AVS 4.x
Software, by changing to the application via Alt+Tab.
Number of repeat
measurements
Different specifications for
the different items
Start page.
Start measure!
Stop measure.
Close project
Measurement
results of
current pro-
ject.
View recipe for
current pro-
ject.
View previous (not
current) pro-jects.
View error
(event) list.
Start a
measurement
Stopp
measurement.
Close
Project