3_AVS-V2_MCT-UM-internal_EN_07-2019.pdf - 第176页
ASM AVS - U SER M ANUAL P AGE 176 OF 182 • C ompar ison of diff ere nt mac hin e sp ecifi cati ons 4 sigma is gen eral ly u sed in s peci fica tio ns fo r S IPL ACE ma chin es. Ot her man ufact urer s of - te n use 3 Sig…
ASM AVS - USER MANUAL
PAGE 175 OF 182
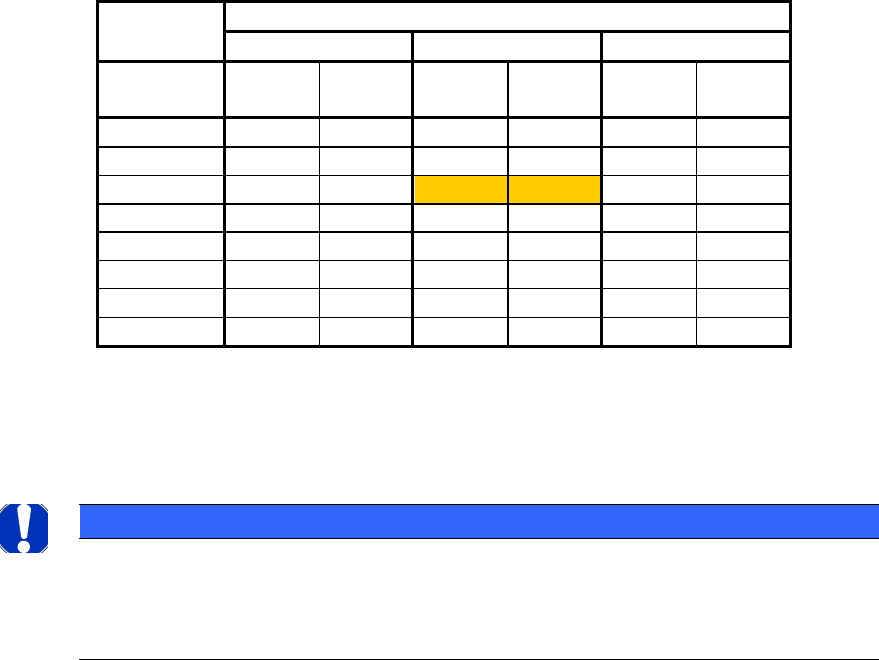
• Confidence intervals for the capability indices
When creating a measurement plan (recipe), the confidence intervals must be taken into
consideration when taking a decision about the number of components placed per place-
ment head.
Explanation:
Because the capability indices (Cm, Cmk) are calculated on the basis of random samples, it
must be assumed that these are randomly influenced within certain limits, and therefore
represent an estimation.
This influence is specified by means of confidence intervals.
The confidence interval expresses the degree to which the calculated Cm or Cmk value can
very depending on the size of the random sample at an assumed probability of 95 %.
The table above shows the confidence intervals (Cmk
l
through
cmk
u
)
depending on the size of the random sample.
NOTICE
Because measurements are only taken with random samples of < 50 components per individual head in
most of the standard machine capability analyses, the confidence interval with reference to the "Number
of measured values" must be taken into account when evaluating the results of the measurement (calcu-
lated Cmk value). A result should therefore only be deemed GOOD if it is significantly above cmk
u
Cm value, Cmk value
1
1.33
1.67
Number of
values
Cmk
l
Cmk
u
Cmk
l
Cmk
u
Cmk
l
Cmk
u
20
0.71
1.29
0.95
1.71
1.21
2.13
40
0.79
1.21
1.07
1.59
1.35
1.99
50
0.82
1.18
1.1
1.56
1.38
1.96
75
0.85
1.15
1.14
1.52
1.44
1.9
100
0.87
1.13
1.17
1.49
1.47
1.87
200
0.91
1.09
1.21
1.45
1.53
1.81
500
0.94
1.06
1.26
1.4
1.58
1.76
1000
0.96
1.04
1.28
1.38
1.61
1.73

ASM AVS - USER MANUAL
PAGE 176 OF 182
• Comparison of different machine specifications
4 sigma is generally used in specifications for SIPLACE machines. Other manufacturers of-
ten use 3 Sigma in their specifications.
Some customers require calculation to be performed on the basis of a 5 Sigma specifica-
tion and a general trend toward 5 Sigma and 6 Sigma specifications can be observed.
The following should be taken into account if the different specifications are to be com-
pared.
If results are required for 5 or 6 Sigma, it is always necessary to first clarify whether this
change is intended to tighten the way in which specifications are made by default or
whether an evaluation on the basis of 5 or 6 Sigma is to be performed in a manner equiva-
lent to the standard specification of 4 Sigma.
Refer to the table below.
NOTICE
Sigma specifications must not simply be exchanged.
It may be necessary to adjust the specification limits to do this.
This means that if you want to derive an equivalent specification with reference to 5 Sigma
from a specification of 90 µm / 4 Sigma, the following applies:
±90 µm / 4 = 22.5 µm (1σ) => 22.5*5 = ±112.5 (~±113 µm).
I.e. an equivalent 5σ specification for ±90 µm / 4 σ is ±113 µm.
Thus, if the 5σ specification is required while maintaining the same limits, attention should
be drawn to the fact that the machine is to be some ±23 µm better than with the default
specification.
4 sigma
(SIPLACE default)
Equivalent values for...
3 sigma
5 sigma
6 sigma
in µm
in µm
in µm
in µm
120
90
150
180
90
68
113
135
80
60
100
120
70
53
88
105
60
45
75
90
50
38
63
75
40
30
50
60
30
23
38
45
20
15
25
30
15
11
19
23
ASM AVS - USER MANUAL
PAGE 177 OF 182
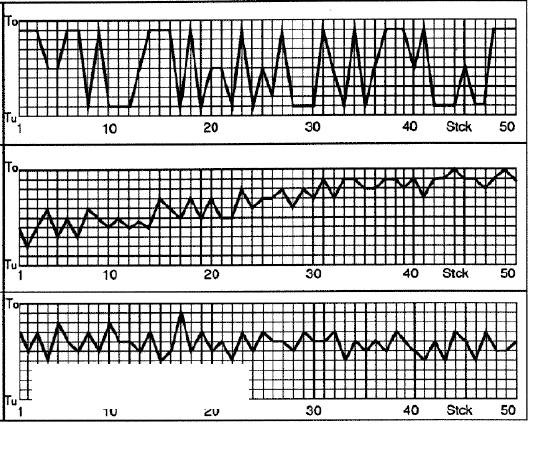
7.4.2 Notes on evaluating the Single Value chart:
The first thing to consider when evaluating the chart is whether a normal distribution is shown.
(1) Normal distribution?
a) Chaotic distribution:
The measured values jump chaotically between a few values.
This means that the individual values are not normally distributed. The machine is not
deemed capable.
b) Normal distribution with a trend:
The measured values follow a trend that indicates systematic influences on the process. The
process must be stabilized, for instance by mapping.
c) Normal distribution without a trend:
The measured values are randomly distributed around a constant mean value, allowing the
measured values to be evaluated statistically and the machine capability indices to be de-
termined.
a)
b)
c)
T
u
: upper tolerance limit
Tu: lower tolerance limit
To: upper tolerance limit