3_AVS-V2_MCT-UM-internal_EN_07-2019.pdf - 第96页
ASM AVS - U SER M ANUAL P AGE 96 OF 182 f. Sin gle Valu e Chart : Show s t he r esul t of the sel e cted mea sureme nt depen ding o n the Filte r s ett ings abo ve . CAUTION It is not possible to display graphs together …
ASM AVS - USER MANUAL
PAGE 95 OF 182
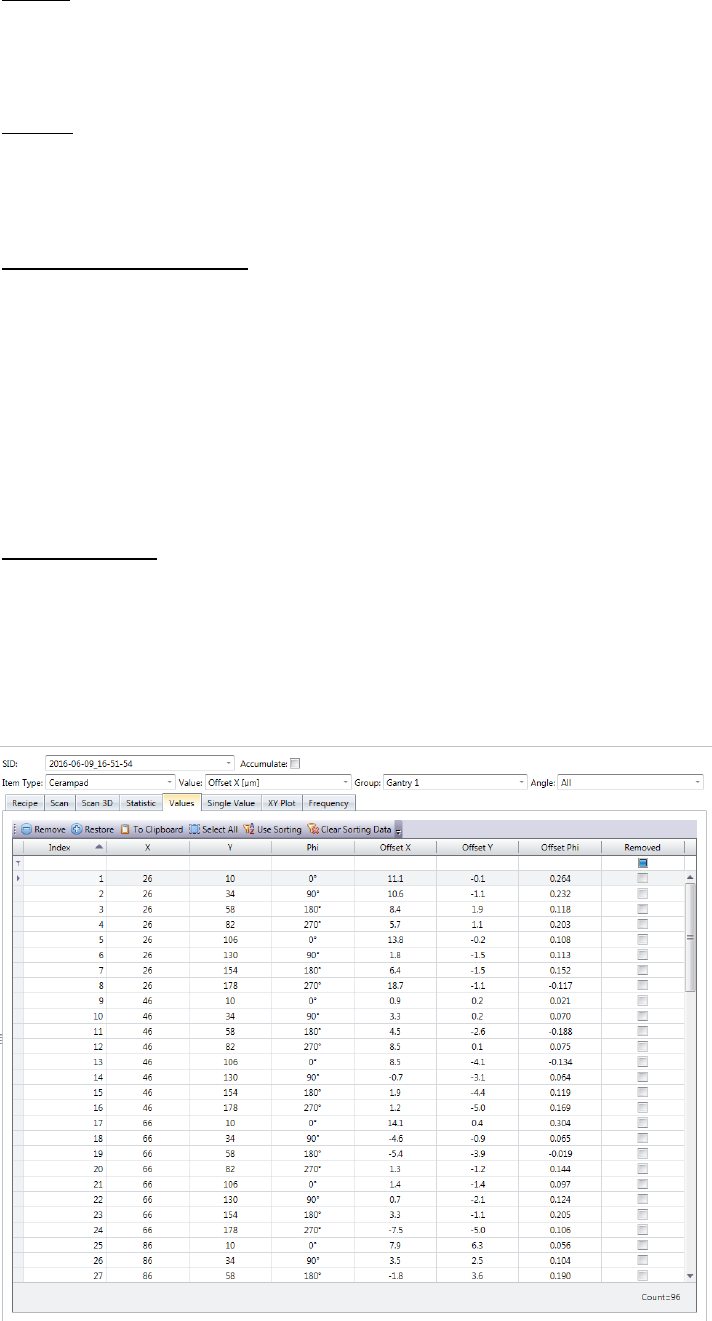
e. Values:
This view shows a table with all the values that go into the calculation, or into the
drawing of the graphics.
Sorting:
Since the nominal values of the measuring points are listed in this table, it is also pos-
sible to reorder the measurement result.
Press the button "Use Sorting" show the graphic "single value" in this sequence.
Omit measurement points:
When troubleshooting, it is sometimes helpful to omit individual values, thus taking it
out of the calculation. This is especially helpful on printing projects, to remove
smeared points from the result.
Highlight the line of the appropriate measuring value (in blue) and click on the button
"Remove". The checkbox in the „Removed” column indicates whether a measurement
point was omitted.
To add the measured value into the result again, highlight the corr. sine and click on
the button "Restore".
Exporting Result:
Using this table, the result can be transmit to an Excel sheet. Highlight either all rows
that you want export, or click "Select All" to the entire table.
Then press the button "To Clipboard".
You can then paste these values to the Excel table, or even to a normal text editor
from the clipboard.
ASM AVS - USER MANUAL
PAGE 96 OF 182
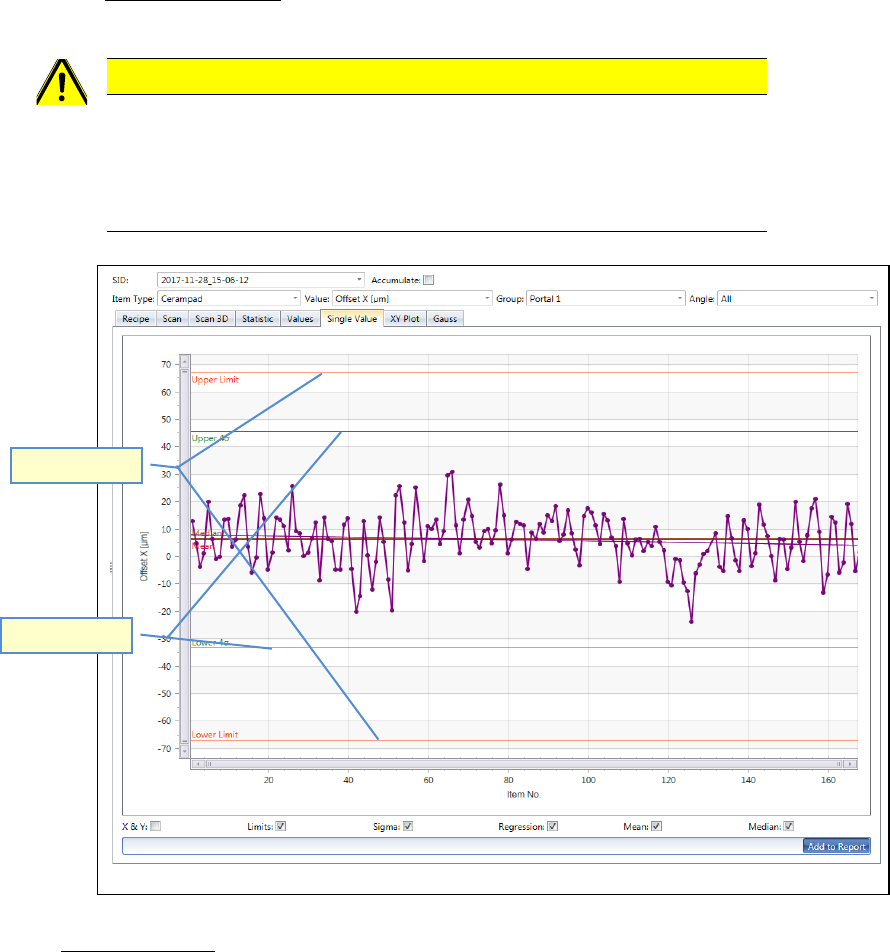
f. Single Value Chart:
Shows the result of the selected measurement depending on the Filter settings above.
CAUTION
It is not possible to display graphs together which have different specification limits
(nominal values). e.g. X- and Y- axis cannot be shown together with the angle graph.
The indication of the specification limits is hanging on the “Item”.
Therefore, it is possible to evaluate different “Items” with different spec. limits.
Evaluation lines:
- Sigma limits (green) show, at which offset value the given accuracy class (e.g. 4 Sigma)
will be achieved by the actual result.
In the example above, the required 4 Sigma (cmk=1,33) is already achieved at approx. -
+45µm and -35µm for the X-axis (green line).
The specification limits are at +/- 67µm (red line)
- Regression lines (same color as Values): show the mean value trend (floating average)
of the result.
- Mean and Median (same color as Values): both average values can be displayed as a
line in the graph, too. Different to the floating regression line, these are always straight.
Spec. Limits
Sigma Limit
ASM AVS - USER MANUAL
PAGE 97 OF 182
On the bottom of the chart, you can activate or deactivate all the evaluation lines.
- If you want to see either X-Offset values or Y-Offset values is organized by the filter set-
tings on top of the graph.
But if you want to see both, X- and Y- Offsets in one picture, you need to activate the
checkbox “X & Y” on the bottom of the graph.
The Y-Offset then is always shown in the same color, but in dashed line.
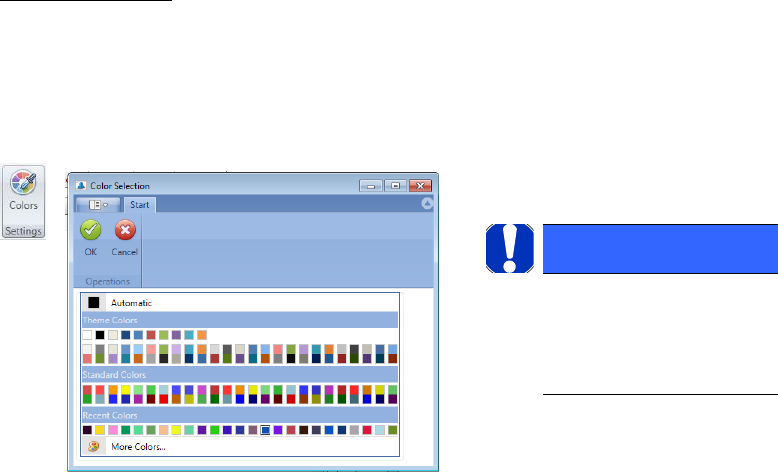
Set color of graph:
The color for the graph is normally set automatically for each measurement.
But you can change the color for each measurement.
Highlight the line of the corresponding measurement in the table and press “Colors” in the
menue bar.
NOTICE
After changing the color you
need to refresh the view, e.g.
by changing to the Recipe tab
and back to Analysis.