3_AVS-V2_MCT-UM-internal_EN_07-2019.pdf - 第125页
ASM AVS - U SER M ANUAL P AGE 125 OF 182 5.3.2.2 »Current Results« after a measurement: Whe n t he me asurem ent is fini shed , t he »L ive Imag e« t ab is hidde n. I nste ad, y ou see six new tab s, t hus res ultin g i …
ASM AVS - USER MANUAL
PAGE 124 OF 182
5.3.2 »Current Results«
The »Current Results« page is explained here using the example of the self-test project.
5.3.2.1 »Current Results« during the measurement«
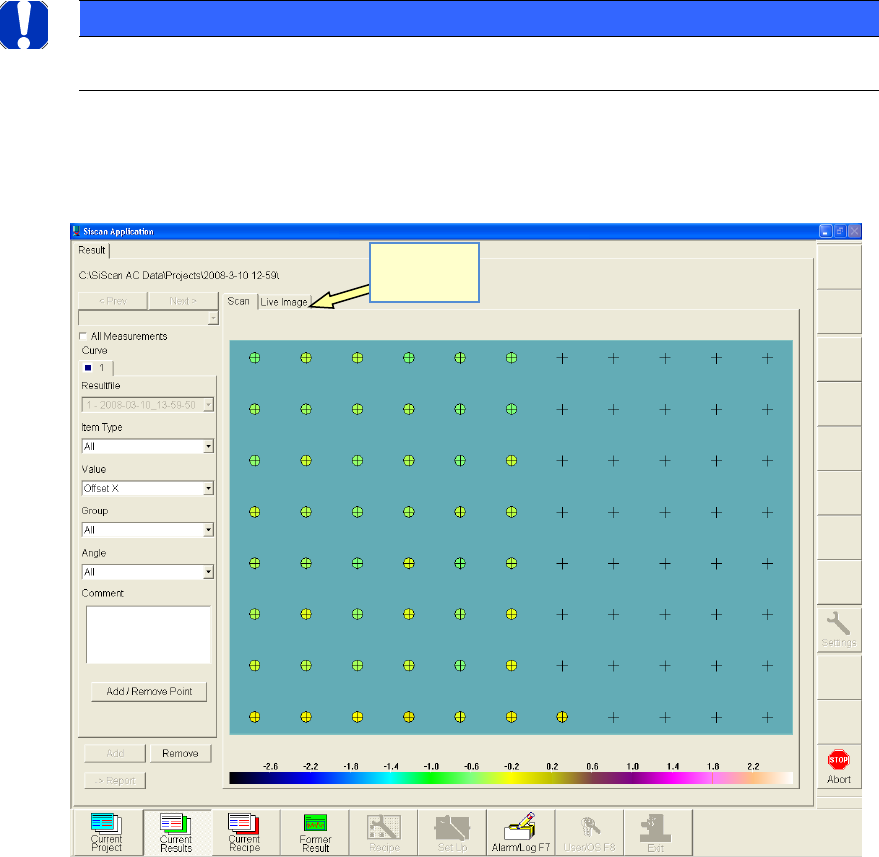
When you start the measurement, the following screen is displayed.
• The turquoise rectangle in the center of the view represents the size of the glass board.
• The gray crosses indicate the measurement points (placement positions).
• The colored circles indicate the measurement results. The assigned color matches the scale displayed
below.
• The colored circles that have already been created make it possible to identify the progress of the
measurement.
For control purposes, you can also activate a »live Image«.
NOTICE
Please note that viewing the live image slows down the measurement!
The selection boxes on the left-hand side allow you, for example,
to switch between X-axis, Y-axis and angle
Switch to
live image!
ASM AVS - USER MANUAL
PAGE 125 OF 182
5.3.2.2 »Current Results« after a measurement:
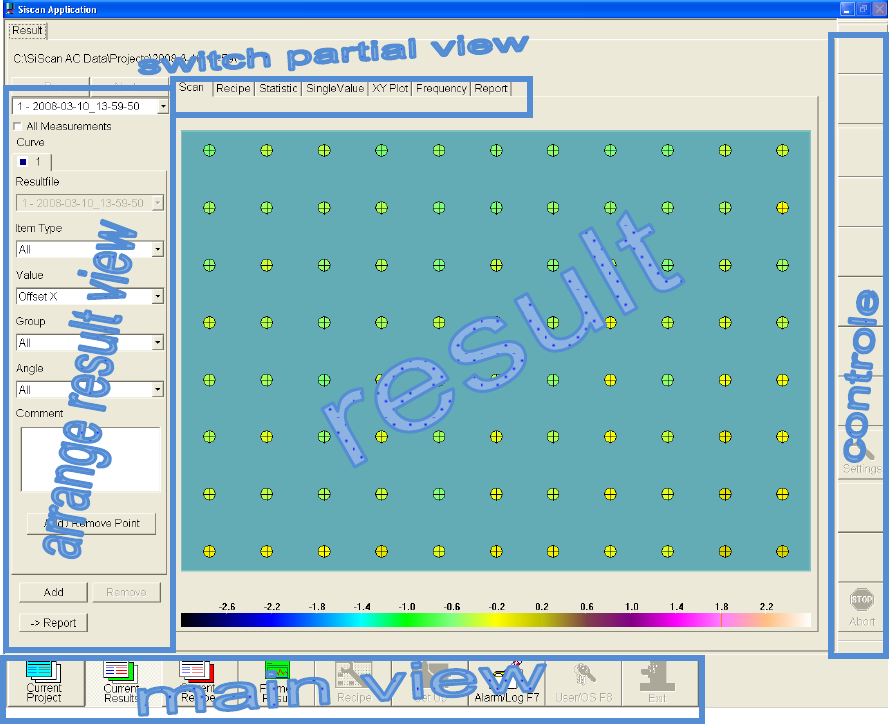
When the measurement is finished, the »Live Image« tab is hidden. Instead, you see six new
tabs, thus resulting in the following screen:
• In the »Choose result display« area (left), you can filter the results displayed in the »Result«
area.
• In the top area »Switch to partial view«, you can choose the type of analysis for the display
in the »Results« area.
• In the »Control« area (right), various buttons are provided for the individual views.
• In the »Main view« area (bottom), you can switch between project control, the result view,
recipe view and the error log.
ASM AVS - USER MANUAL
PAGE 126 OF 182
5.3.2.3 »Current Results«, selecting the result display
To If the »All Measurements« switch is activated then all the measurements in the project are
summarized in a single result. All the statistical values are then calculated and displayed using
this multiple basis.
To The individual results are displayed as tabs with colored and symbolic labels.
For all views apart from »Single Value« (single value chart) and »XY Plot«, the active tab is re-
sponsible for the display in the »Results« area.
In the two above-mentioned graphical display modes, this result tab can be used to construct a
result chart with up to 6 different graphs.
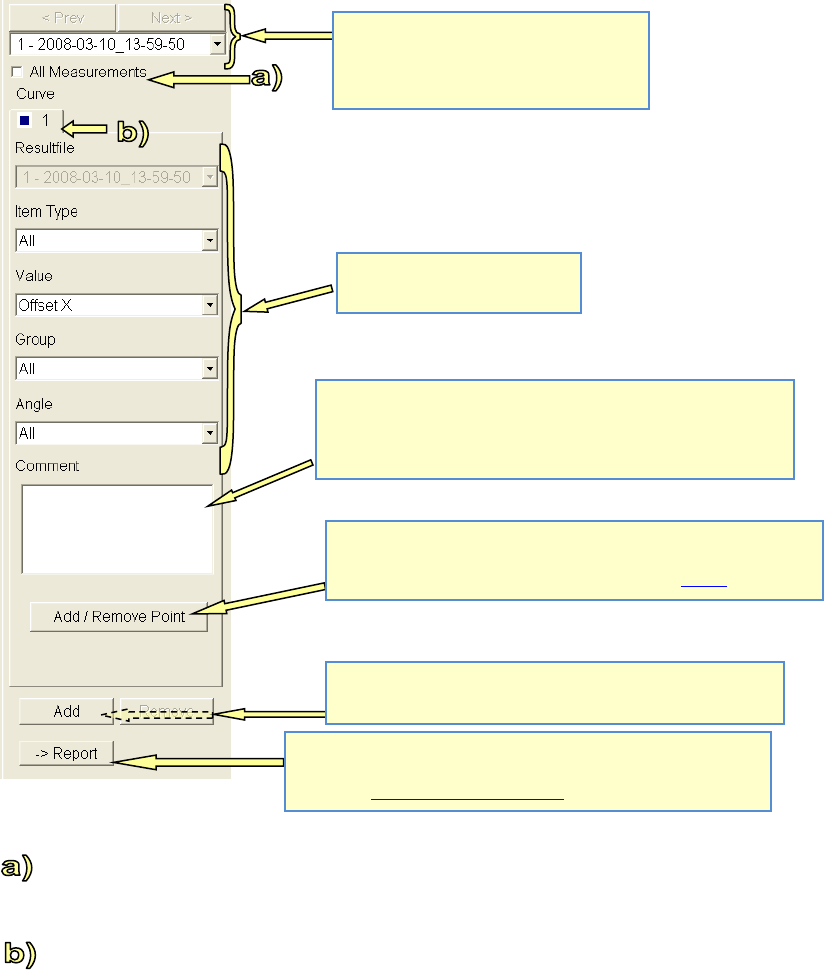
Switches between the individual project
measurements.
The measurement chosen here is used as
the basis for Graph 1!
Filter options for the display in
the result view:
You can add a comment for the corresponding measurement here.
This makes it possible to manage a project history.
This comment is an internal comment! It is not possible to show
this comment in the report!
The "Add / Remove Point" button is only active in Scan view!
This makes it possible to eliminate any outliers, for example due to
dirt on the board, or restore such points. See also 4.3.2.4
Click the "Add" button to add a further analysis (e.g. another
graph). "Remove" removes it again.
When you click on the "-> Report" button, the exact screen dis-
played in the results area is taken over into the report. (e.g. screen-
shot). See 4.3.2.10 »Current Results« – »Report«: