3_AVS-V2_MCT-UM-internal_EN_07-2019.pdf - 第177页
ASM AVS - U SER M ANUAL P AGE 177 OF 182 7. 4.2 No tes on eval uati ng the Sin gl e V alue ch art: The fir st t hin g to cons ide r whe n ev aluat ing the c hart i s w heth er a no rmal dist ribu tio n is sho wn. (1) Nor…
ASM AVS - USER MANUAL
PAGE 176 OF 182
• Comparison of different machine specifications
4 sigma is generally used in specifications for SIPLACE machines. Other manufacturers of-
ten use 3 Sigma in their specifications.
Some customers require calculation to be performed on the basis of a 5 Sigma specifica-
tion and a general trend toward 5 Sigma and 6 Sigma specifications can be observed.
The following should be taken into account if the different specifications are to be com-
pared.
If results are required for 5 or 6 Sigma, it is always necessary to first clarify whether this
change is intended to tighten the way in which specifications are made by default or
whether an evaluation on the basis of 5 or 6 Sigma is to be performed in a manner equiva-
lent to the standard specification of 4 Sigma.
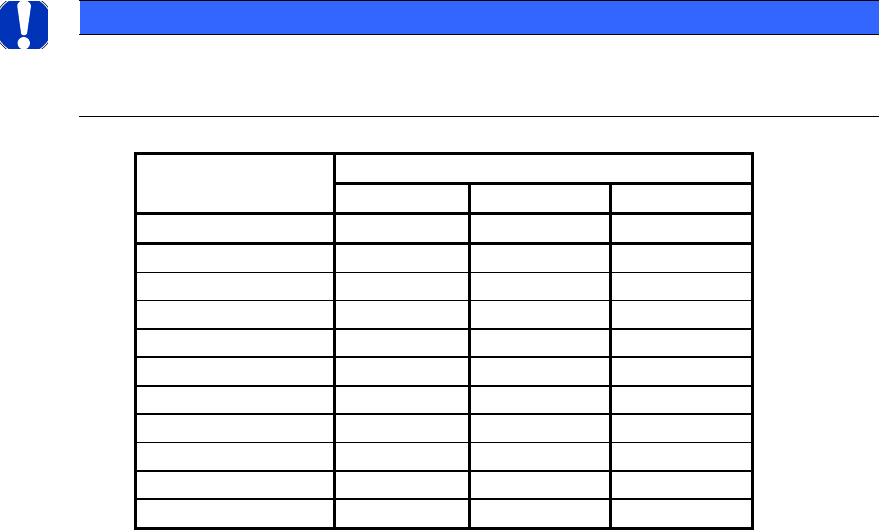
Refer to the table below.
NOTICE
Sigma specifications must not simply be exchanged.
It may be necessary to adjust the specification limits to do this.
This means that if you want to derive an equivalent specification with reference to 5 Sigma
from a specification of 90 µm / 4 Sigma, the following applies:
±90 µm / 4 = 22.5 µm (1σ) => 22.5*5 = ±112.5 (~±113 µm).
I.e. an equivalent 5σ specification for ±90 µm / 4 σ is ±113 µm.
Thus, if the 5σ specification is required while maintaining the same limits, attention should
be drawn to the fact that the machine is to be some ±23 µm better than with the default
specification.
4 sigma
(SIPLACE default)
Equivalent values for...
3 sigma
5 sigma
6 sigma
in µm
in µm
in µm
in µm
120
90
150
180
90
68
113
135
80
60
100
120
70
53
88
105
60
45
75
90
50
38
63
75
40
30
50
60
30
23
38
45
20
15
25
30
15
11
19
23
ASM AVS - USER MANUAL
PAGE 177 OF 182
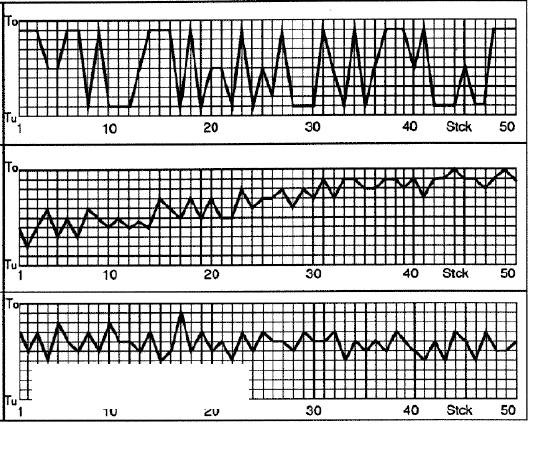
7.4.2 Notes on evaluating the Single Value chart:
The first thing to consider when evaluating the chart is whether a normal distribution is shown.
(1) Normal distribution?
a) Chaotic distribution:
The measured values jump chaotically between a few values.
This means that the individual values are not normally distributed. The machine is not
deemed capable.
b) Normal distribution with a trend:
The measured values follow a trend that indicates systematic influences on the process. The
process must be stabilized, for instance by mapping.
c) Normal distribution without a trend:
The measured values are randomly distributed around a constant mean value, allowing the
measured values to be evaluated statistically and the machine capability indices to be de-
termined.
a)
b)
c)
T
u
: upper tolerance limit
Tu: lower tolerance limit
To: upper tolerance limit
ASM AVS - USER MANUAL
PAGE 178 OF 182
NOTICE
The sequence of the measurement is fully reflected in the "Single Value Chart". You should therefore take
into account the measurement sequence when interpreting the chart.
See also 4.3.5.3.8 Adjustment of measurement sequence.
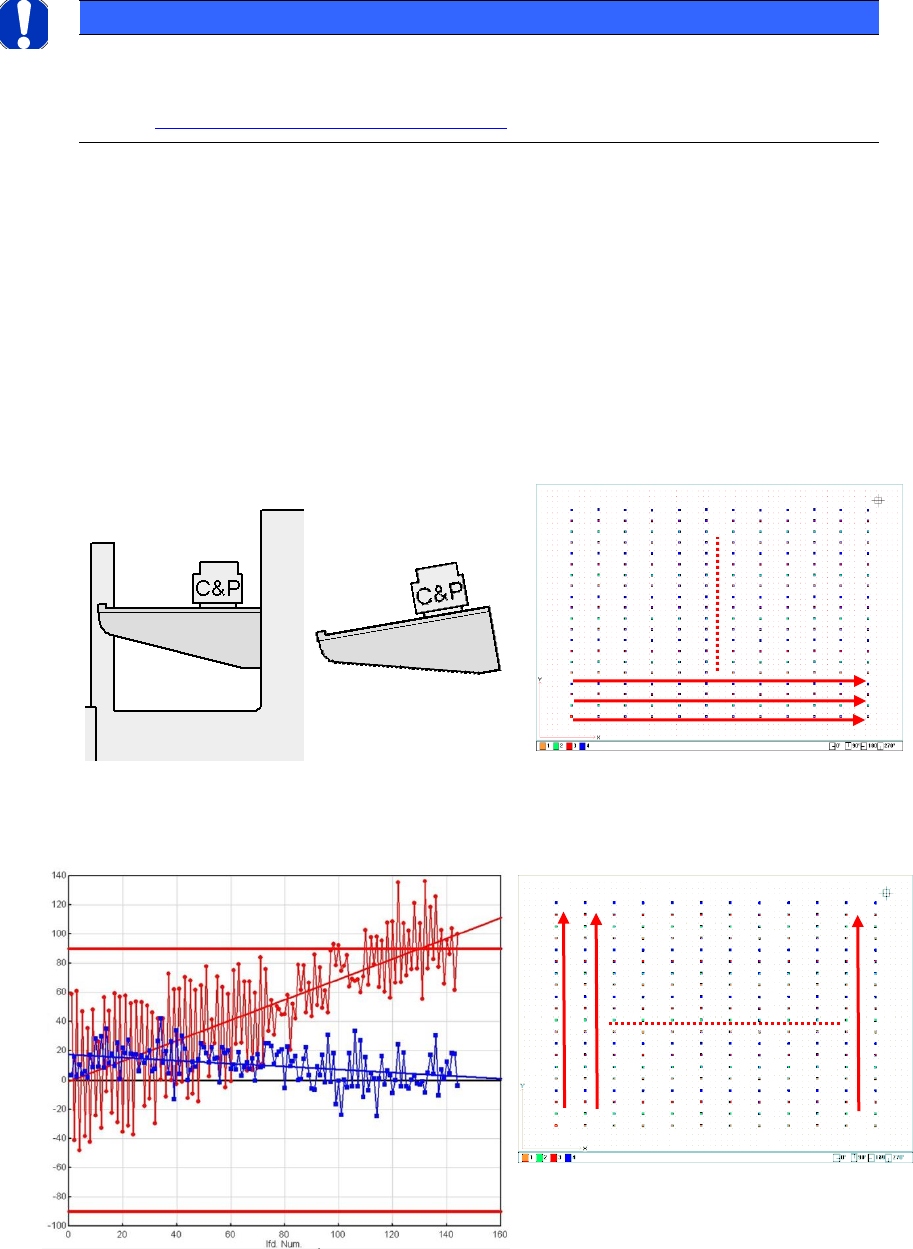
(2) Trend mapping?
When interpreting trends in particular, attention must be paid to the relationship between
the placement sequence and the measurement sequence.
Assumptions:
The gantry is positioned obliquely in Y.
The head has rolled over the star in X. Thus, if you view the board from above, the compo-
nents were placed from lef-t to right in one head cycle.
The next head cycle follows in an upward direction.
If the measurement was performed column-by-column and without changing direction, the
result is as follows.
Portalverzug
Measuring sequence
Measuring sequence