3_AVS-V2_MCT-UM-internal_EN_07-2019.pdf - 第91页
ASM AVS - U SER M ANUAL P AGE 91 OF 182 Det ails to the are a ( 2) „ Fil ter for meas ure ment“ a. SID - Mea surem ent : If yo u s ele ct mo re t han one m easu reme n t i n th e li st o n the le ft han d s ide, you c an…
ASM AVS - USER MANUAL
PAGE 90 OF 182
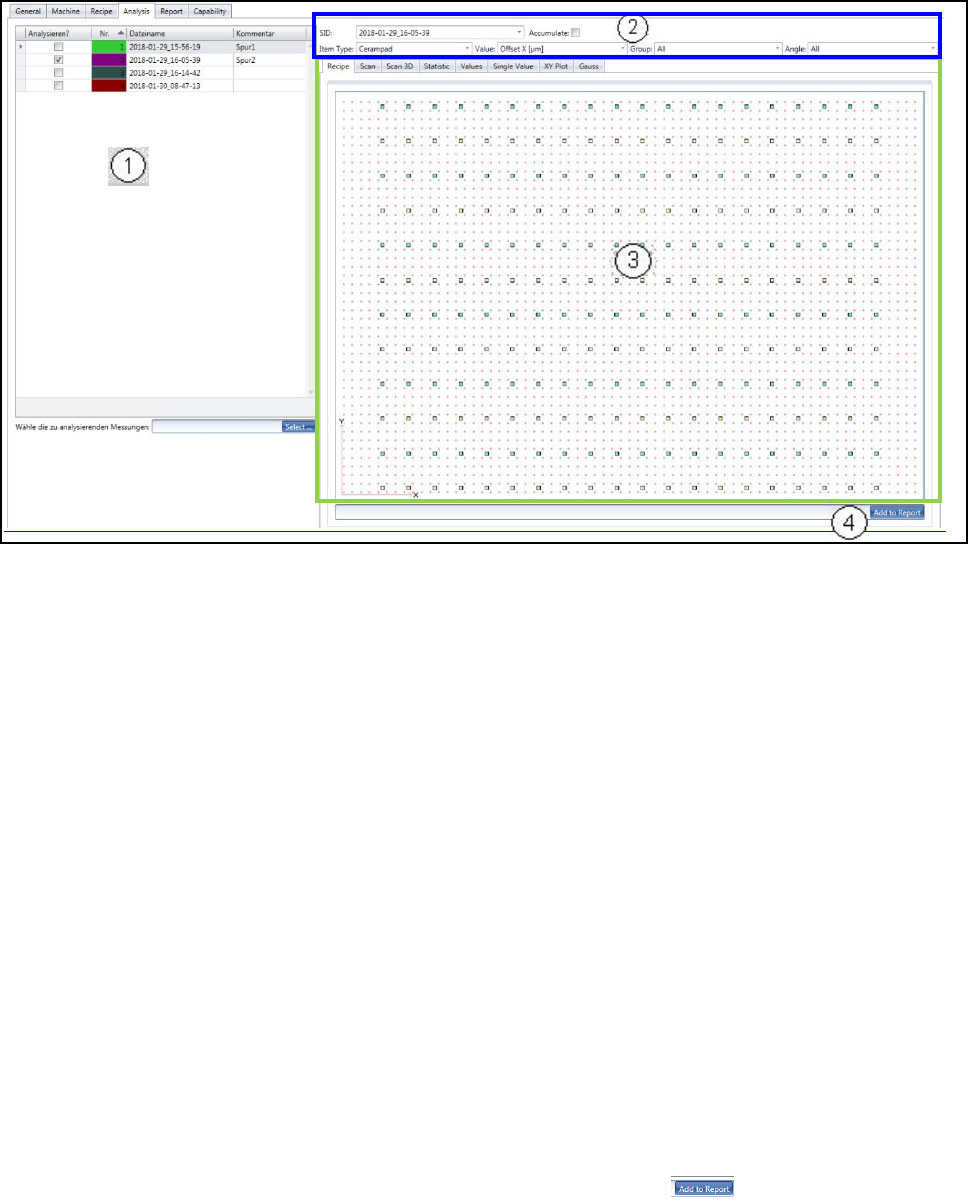
5.2.24.1.5 Project – Analysis (placement machine)
Once the measurement in the AVS_Scan Software has finished, the software switches back to
the ASM AVS software, onto the “Analysis view”.
The “Analysis view” has 4 parts.
(1) List of measurements in the project.
In this view, the highlighting of a line (measurement) does not mean anything.
To see the measurement details, you need to activate the measurement via the check-
box!
You can select more than one measurement for the analysis.
(2) Filter for measurement data:
On top of the different tabs for analysis, you have one line (if necessary 2 lines) with
drop-down lists (and in some cases check boxes) to filter the results for all the tabs bel-
low!
(3) Result Area:
In this area, all calculations and drawn graphs are displayed, corresponding to the filter
setting above (area 2).
(4) Collecting Report Views:
Each view of area (3) can be add to the report, including a comment.
Just add the comment in the editor field and press the button .
ASM AVS - USER MANUAL
PAGE 91 OF 182
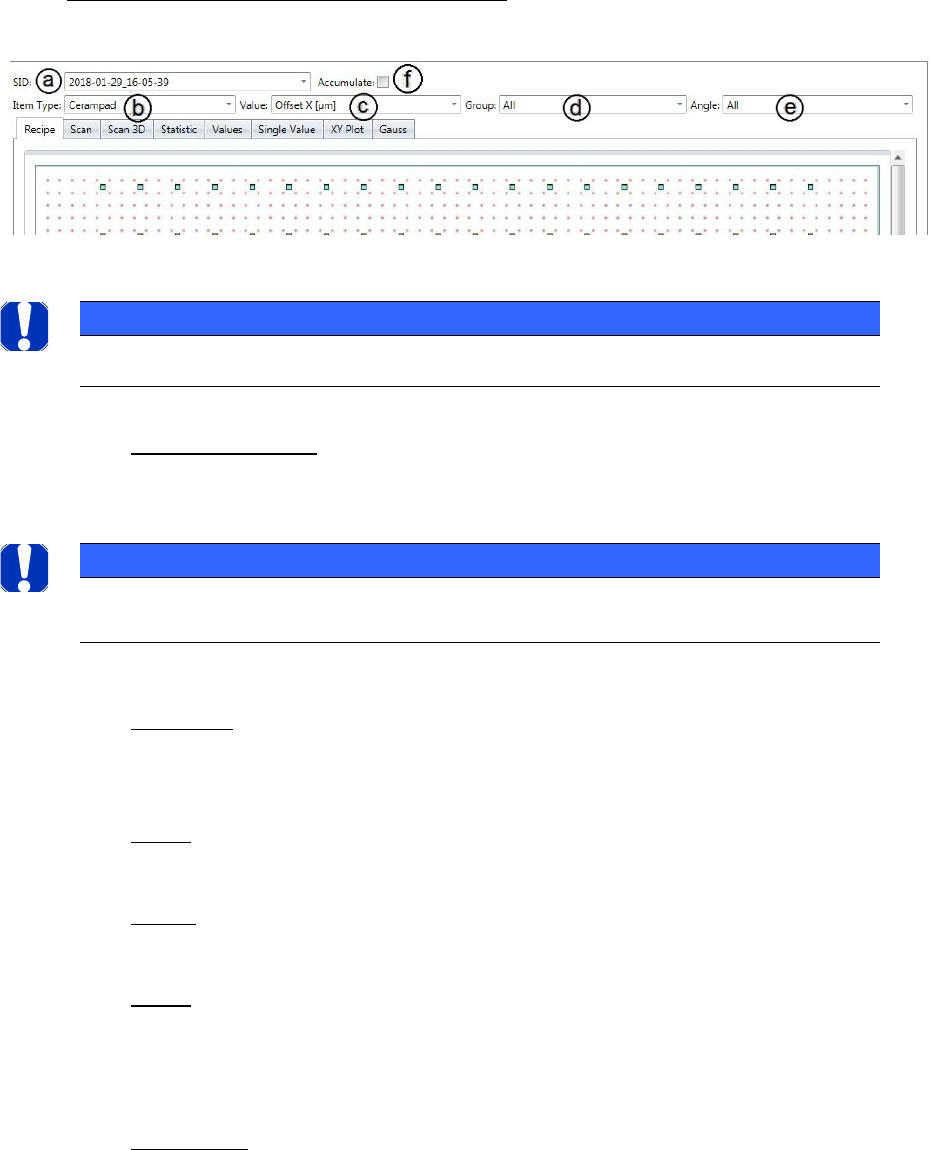
Details to the area (2) „Filter for measurement“
a. SID - Measurement: If you select more than one measurement in the list on the left
hand side, you can then select the measurement you like to see in the tabs bellow, at
this point.
b. Item type: If your recipe consists of more than one Item type, you can change here
between the different types for analysis. Usually you need more than one Item type
for a recipe, if different specifications need to be measured.
c. Value: You can switch between X, Y and phi, for views in the tabs, which can only
show one axis.
d. Group: If your recipe consists of more than one group (e.g. different gantries), you can
switch between the groups here.
e. Angle: The most recipes have placement plans with changing angles of 0°, 90°, 180°,
270°.
These angles can be seen as a group and you can filter your result below regarding this
angle group!
f. Accumulate: If this button is activated, all the measurements selected in the list on
the left side are calculated and presented all together. E.g. if a measurement has 100
measurement points and 3 measurements are selected, the analysis view shows the
result of 300 measurement points all together.
NOTICE
All changes in this area are effecting all different tabs down under!
NOTICE
If more than one measurement is activated, in the “Single Value” tab all measurements are shown togeth-
er, each in the color as allocated in the list beside.
ASM AVS - USER MANUAL
PAGE 92 OF 182
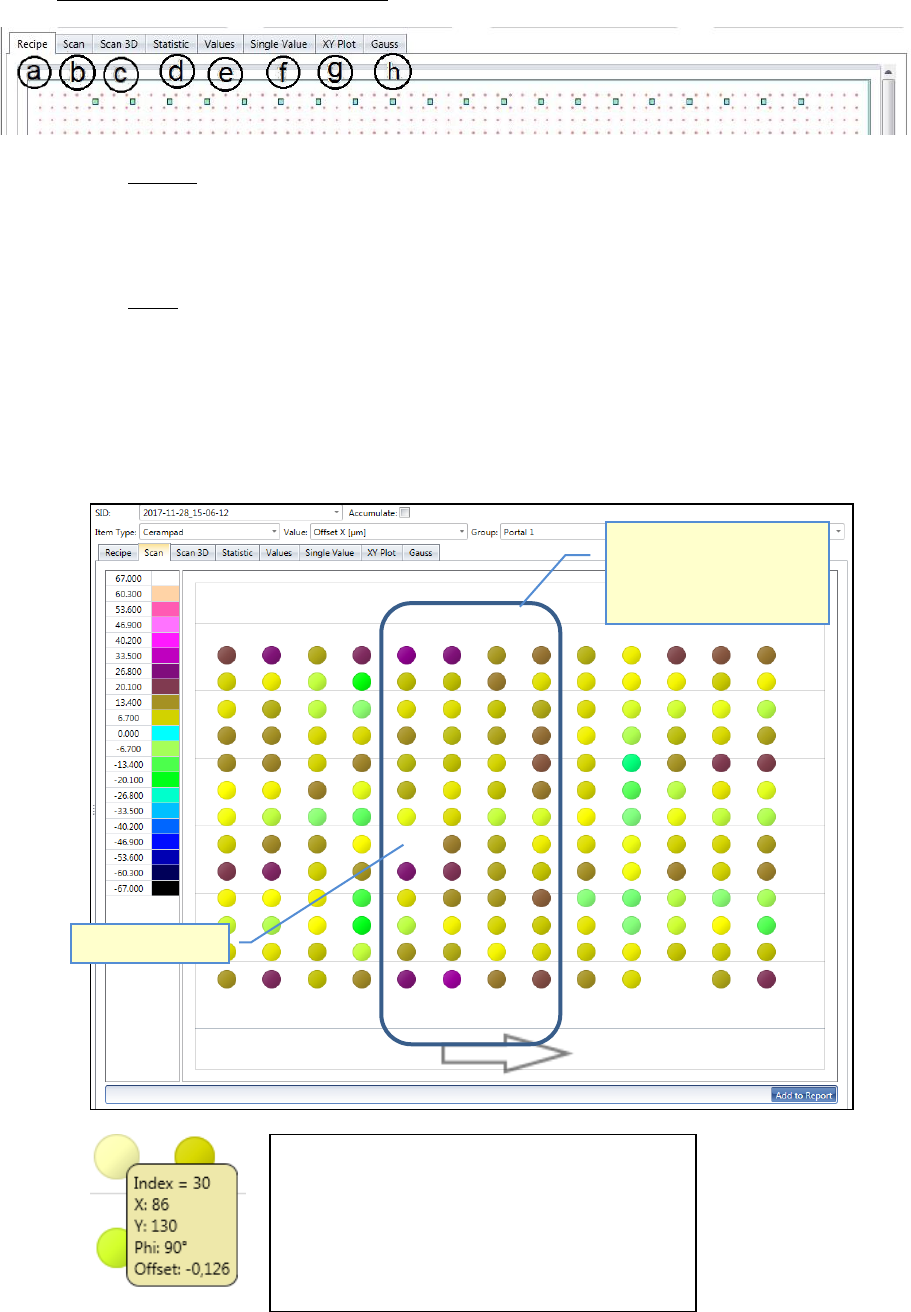
Details to the area (3) „Result Area“
a. Recipe:
Shows the recipe (measuring plan), what is measured in the project, as an image.
This is the only tab, which does not depend on the filter settings above.
b. Scan:
Here, a colored circle is shown for each measurement point, as a kind of color map.
The color represents the size of the offset values, from the axis which was selected via
the filter settings above. The colors are broken down in a legend on the left.
It is a view from the top onto the glass plate. Thus the placement error (offset) can be
analyzed by the gradient, over the entire surface.
Missing Placement!
With this view, peaks,
placement faults and trends
can be localized on the glass
plate.
If you move the mouse over one dot, following
information will be shown in a yellow rectangle:
- Index: position number (measuring sequence)
- X: Specified value (Position on the plate)
- Y: Specified value (Position on the plate)
- Phi: Specified value (Position on the plate)
- Offset: measured offset from the specified…