3_AVS-V2_MCT-UM-internal_EN_07-2019.pdf - 第93页
ASM AVS - U SER M ANUAL P AGE 93 OF 182 c. Sca n 3D : Sim ilar to t he view " Scan " thi s is abo ut t he a naly sis o f t he resu lt o n th e s urface an d thu s th e s pati al va riat ion o f t he e rro r. Th…
ASM AVS - USER MANUAL
PAGE 92 OF 182
Details to the area (3) „Result Area“
a. Recipe:
Shows the recipe (measuring plan), what is measured in the project, as an image.
This is the only tab, which does not depend on the filter settings above.
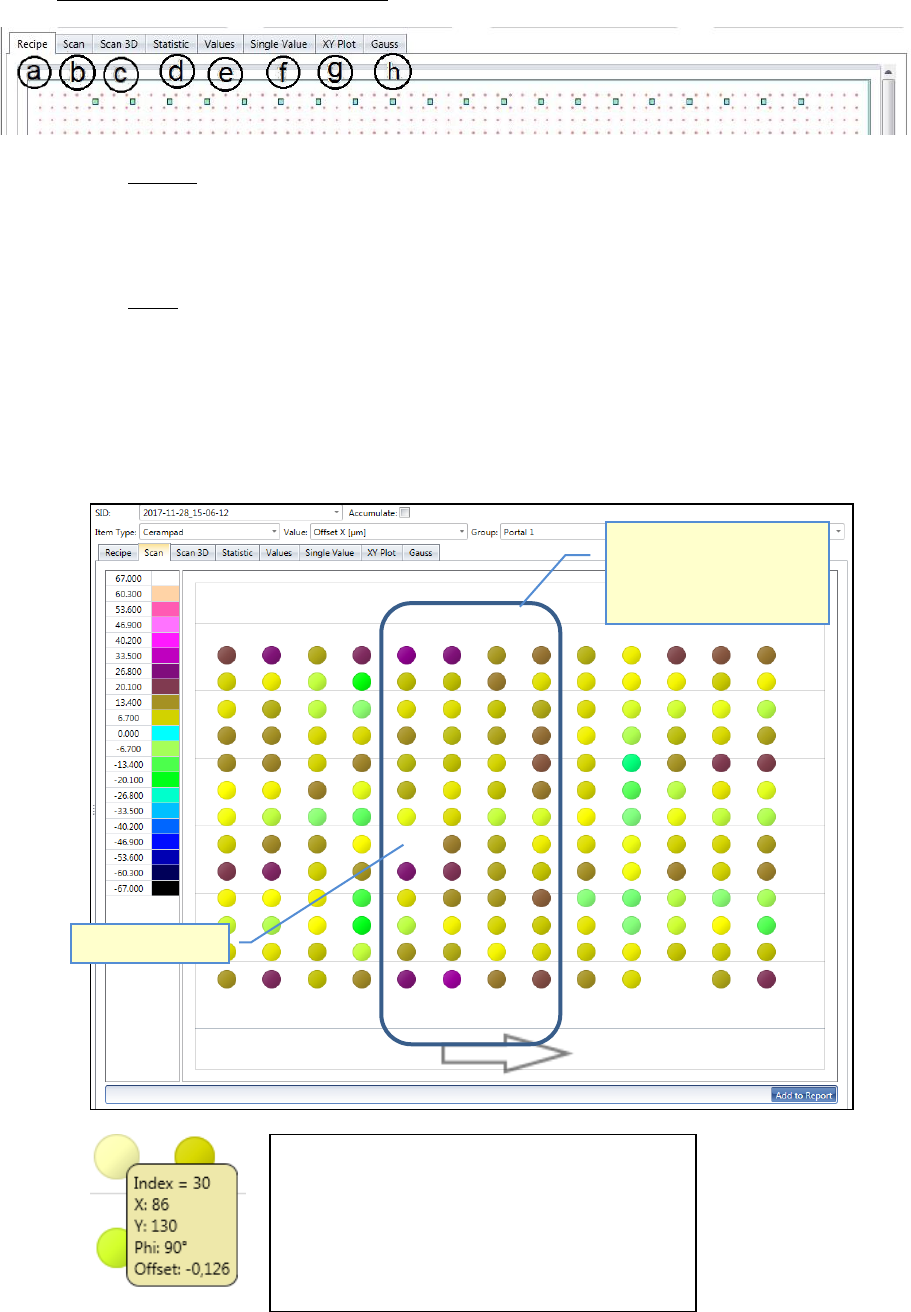
b. Scan:
Here, a colored circle is shown for each measurement point, as a kind of color map.
The color represents the size of the offset values, from the axis which was selected via
the filter settings above. The colors are broken down in a legend on the left.
It is a view from the top onto the glass plate. Thus the placement error (offset) can be
analyzed by the gradient, over the entire surface.
Missing Placement!
With this view, peaks,
placement faults and trends
can be localized on the glass
plate.
If you move the mouse over one dot, following
information will be shown in a yellow rectangle:
- Index: position number (measuring sequence)
- X: Specified value (Position on the plate)
- Y: Specified value (Position on the plate)
- Phi: Specified value (Position on the plate)
- Offset: measured offset from the specified…
ASM AVS - USER MANUAL
PAGE 93 OF 182
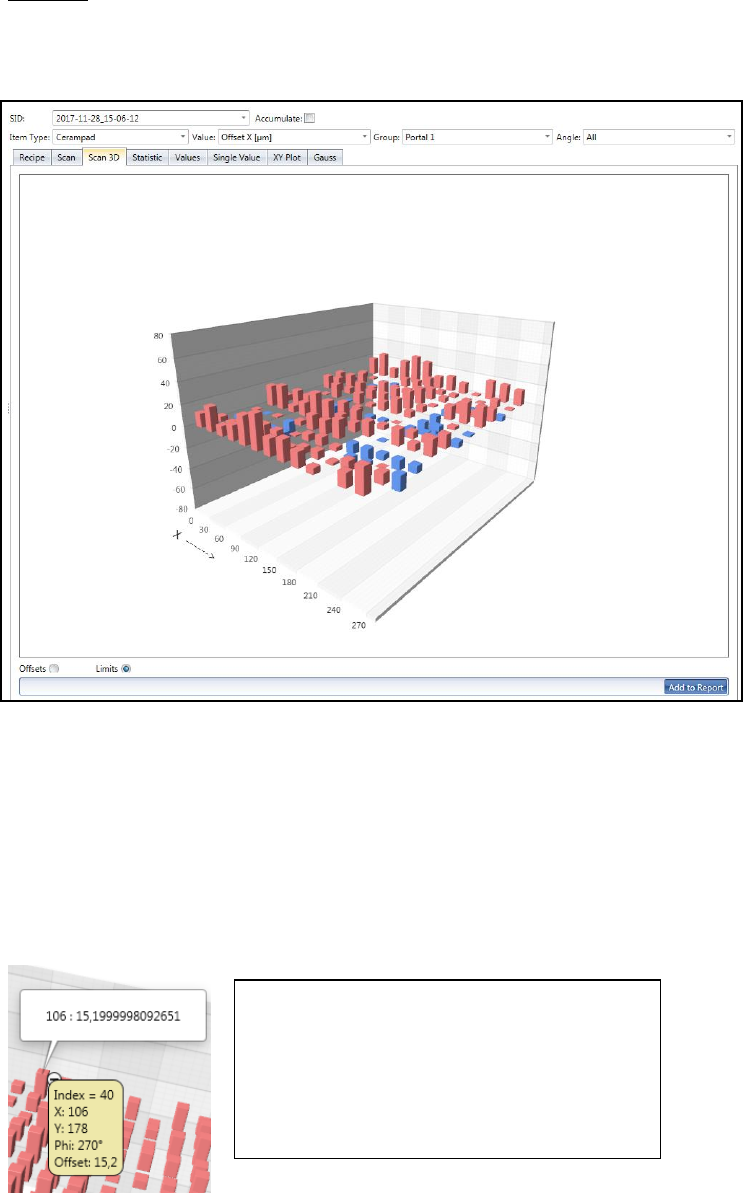
c. Scan 3D:
Similar to the view "Scan" this is about the analysis of the result on the surface and
thus the spatial variation of the error.
The offset values are displayed on bars.
Brick Red bars go up and show the positive offset values.
Blue bars go down and show the negative offset values.
You can turn the chart in all directions by clicking and holding the left mouse button
(cursor has hand form).
With the mouse wheel you can zoom the image in or out.
With the radio buttons "Offsets" vs. "Limits" you can switch the scaling.
For "Offsets", the respective "Min." and "Max." values form the limits of the graphic.
For "Limits" the graph is limited by the values of the specification.
If you move the mouse over one bar, following
information will be shown in a yellow rectangle:
- Index: position number (measuring sequence)
- X: Specified value (Position on the plate)
- Y: Specified value (Position on the plate)
- Phi: Specified value (Position on the plate)
- Offset: measured offset from the specified…
-
ASM AVS - USER MANUAL
PAGE 94 OF 182
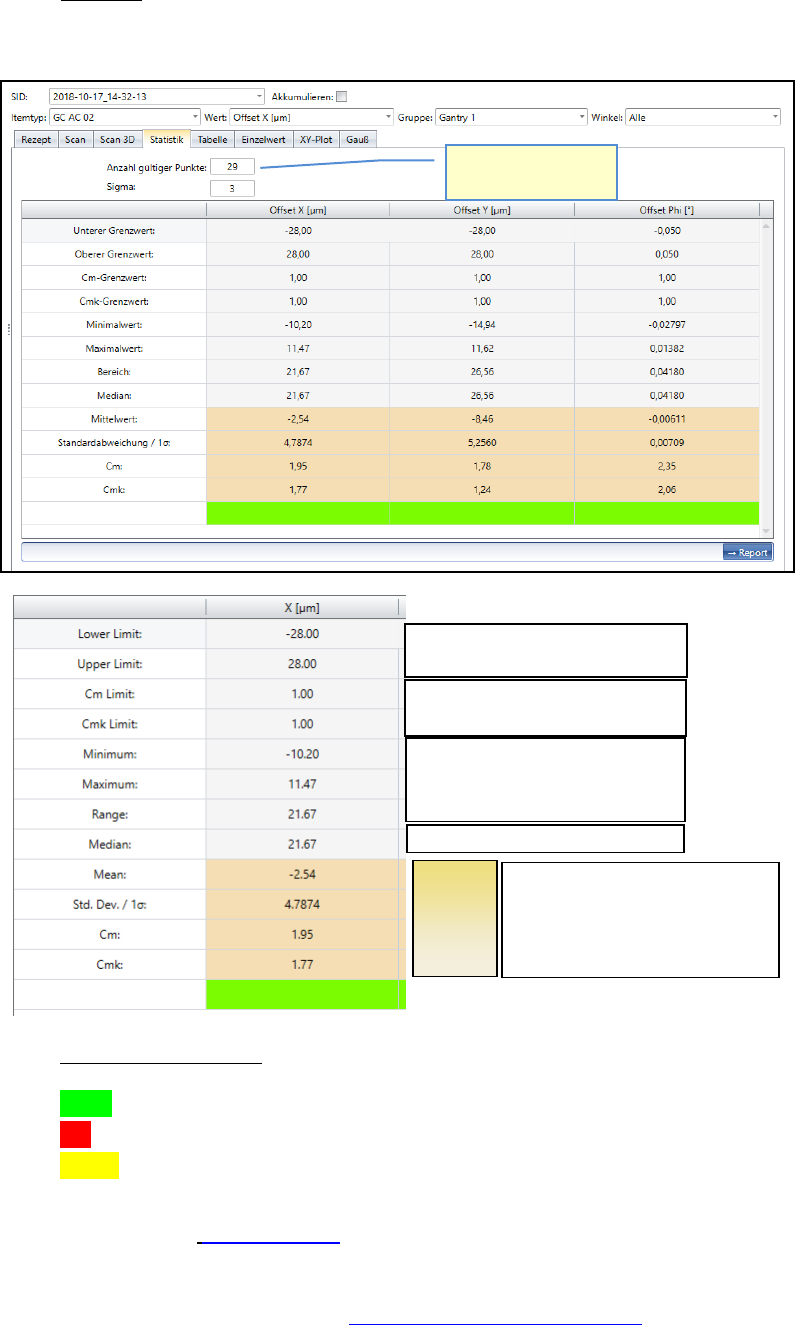
d. Statistic:
Shows the result of the selected measurement depending on the Filter settings above.
Fast result evaluation:
green = c
mk
within nominal value
red = c
m
and c
mk
out of nominal value
yellow = c
m
within, but c
mk
out of nominal value. => Offset correction is necessary
Please see also 6.4.1 Statistics.
The offset can be adjusted to approximate the Cmk value to the Cm value.
How to adjust the offsets? See 6.1 Corrections of Offset values.
Spec. Limits, Dimensions
Spec. Limits, Sigma value
Lowest measured value (min.)
Highest measured value (max.)
Distanz min. to max.
The middle of all values sorted by size.
Factors,
which are
important
for the
result, are
highlighted
Number of values in
the calculation.
Average of all values
Standard Deviation
Cm
Cmk