3_AVS-V2_MCT-UM-internal_EN_07-2019.pdf - 第124页
ASM AVS - U SER M ANUAL P AGE 124 OF 182 5. 3.2 »Cu rr ent Resu lt s« The »C urre nt Re sult s« pa ge i s ex plai ned here usin g th e e xamp le o f t he se lf - test pr ojec t. 5.3.2.1 »Cur rent Results« during the meas…
ASM AVS - USER MANUAL
PAGE 123 OF 182
5.3 »AVS_Scan« (measuring software)
5.3.1 »Current Project« and structure of »AVS_Scan«
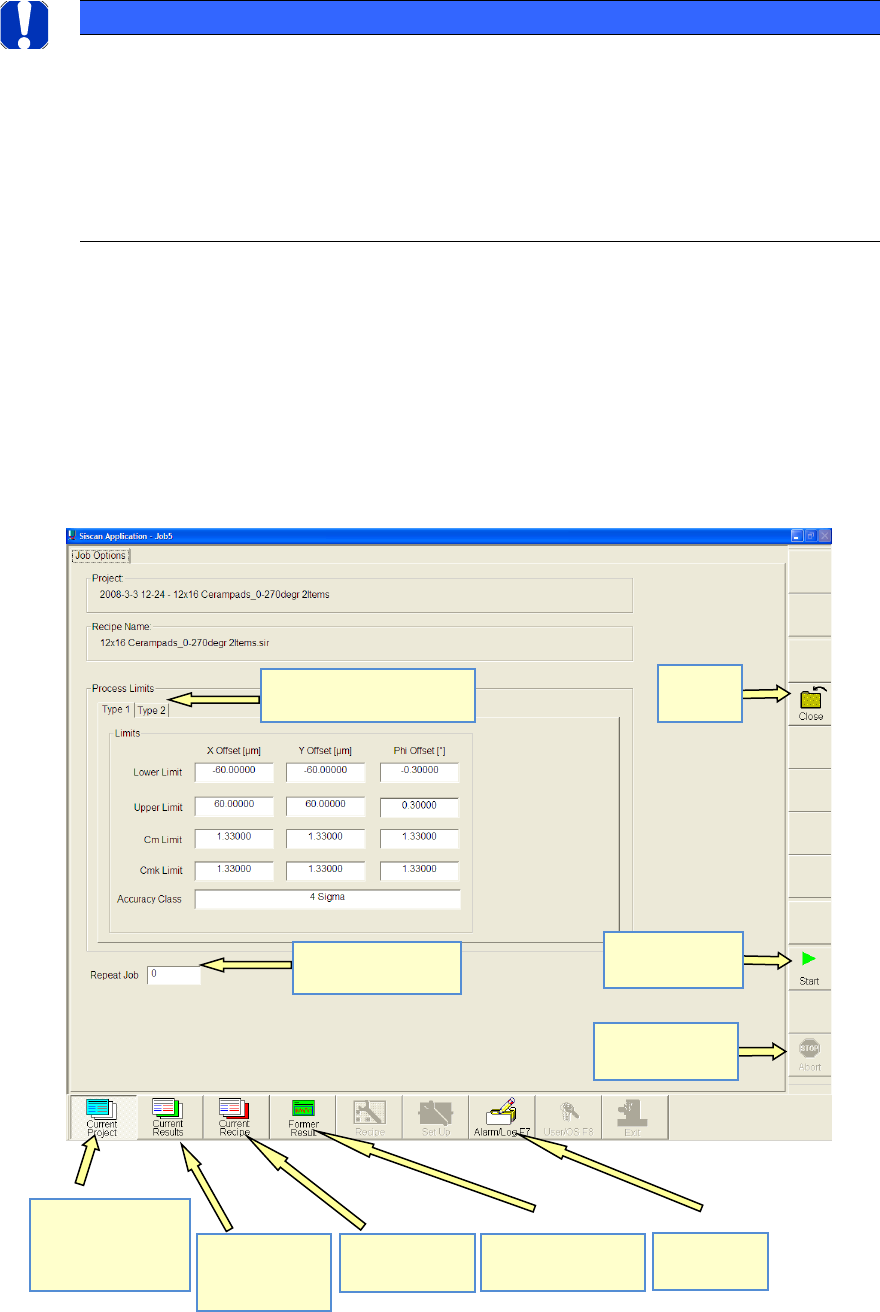
After switching to the measurement software, you see the following view.
This page displays not only the project name and recipe name but also the process limits (speci-
fication limits).
There is a separate specification for each component (item).
You can also specify the number of times the measurement is to be repeated.
NOTICE
Meaning of AVS_Scan Software
With the Software ASM AVS 4.x the calculations and reports are carried out in the ASM AVS part.
The AVS_Scan Software (previously SiScanApplication) is only used for the measuring.
But the chapter from the AVS_Scan Software keeps being part of this document in the full version.
The AVS_Scan software can always be used after forwarding a project or a recipe from the ASM AVS 4.x
Software, by changing to the application via Alt+Tab.
Number of repeat
measurements
Different specifications for
the different items
Start page.
Start measure!
Stop measure.
Close project
Measurement
results of
current pro-
ject.
View recipe for
current pro-
ject.
View previous (not
current) pro-jects.
View error
(event) list.
Start a
measurement
Stopp
measurement.
Close
Project
ASM AVS - USER MANUAL
PAGE 124 OF 182
5.3.2 »Current Results«
The »Current Results« page is explained here using the example of the self-test project.
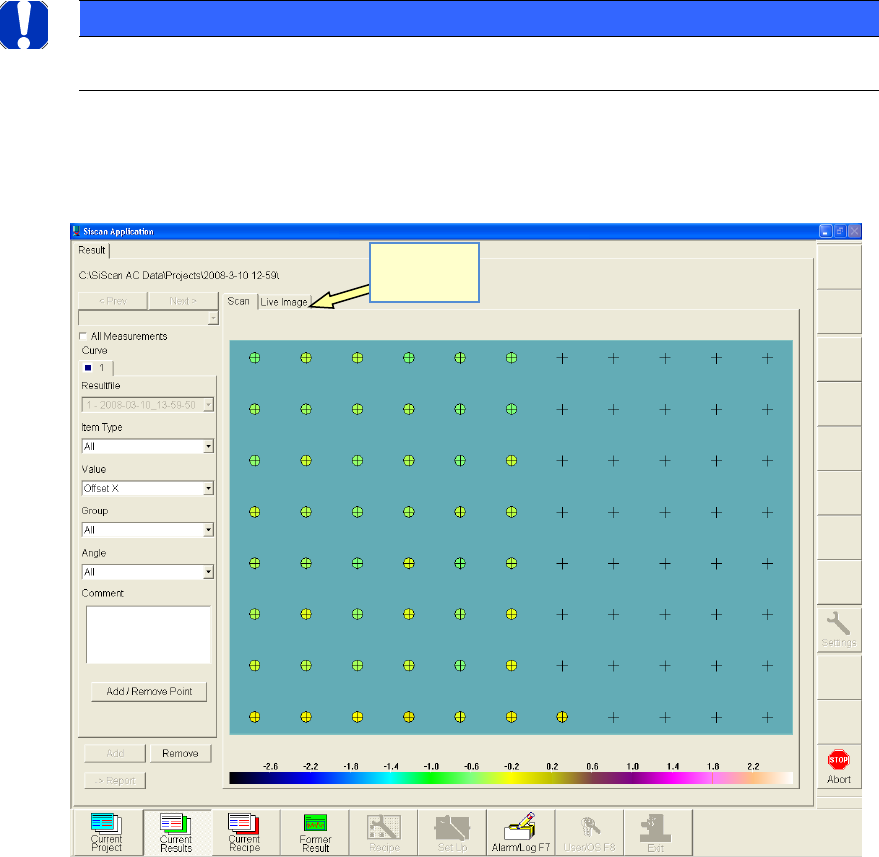
5.3.2.1 »Current Results« during the measurement«
When you start the measurement, the following screen is displayed.
• The turquoise rectangle in the center of the view represents the size of the glass board.
• The gray crosses indicate the measurement points (placement positions).
• The colored circles indicate the measurement results. The assigned color matches the scale displayed
below.
• The colored circles that have already been created make it possible to identify the progress of the
measurement.
For control purposes, you can also activate a »live Image«.
NOTICE
Please note that viewing the live image slows down the measurement!
The selection boxes on the left-hand side allow you, for example,
to switch between X-axis, Y-axis and angle
Switch to
live image!
ASM AVS - USER MANUAL
PAGE 125 OF 182
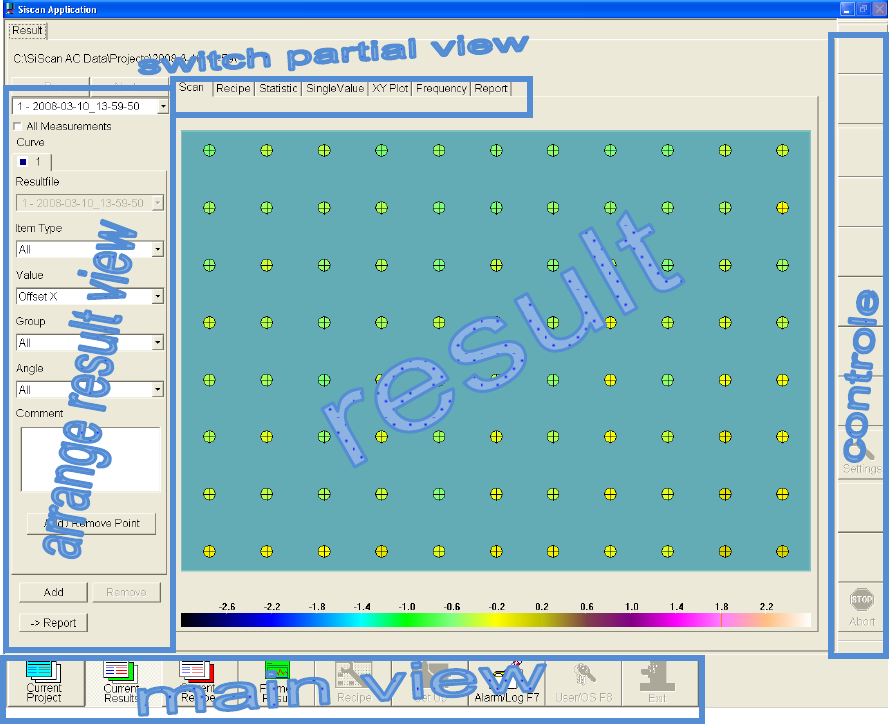
5.3.2.2 »Current Results« after a measurement:
When the measurement is finished, the »Live Image« tab is hidden. Instead, you see six new
tabs, thus resulting in the following screen:
• In the »Choose result display« area (left), you can filter the results displayed in the »Result«
area.
• In the top area »Switch to partial view«, you can choose the type of analysis for the display
in the »Results« area.
• In the »Control« area (right), various buttons are provided for the individual views.
• In the »Main view« area (bottom), you can switch between project control, the result view,
recipe view and the error log.