3_AVS-V2_MCT-UM-internal_EN_07-2019.pdf - 第174页
ASM AVS - U SER M ANUAL P AGE 174 OF 182 The si gma va lue that is used by de fault whe n mak ing spe cifi catio ns for SIPL ACE p lac emen t mac hines i s hig hli ghte d in g ree n in the tab l e. The ta ble s how s tha…
ASM AVS - USER MANUAL
PAGE 173 OF 182
• Minimum Value, Maximum Value, Range
The range is the difference between the minimum and maximum values measured.
• Cm, Cmk
Machine capability analyses document the capability of a manufacturing device (place-
ment machine) to complete a specified processing task (placement of components at the
nominal position) reliably over the long term.
The Cm and Cmk values are the machine capability indices.
The machine capability index Cm is calculated as the quotient of the specification limit and
six times the standard deviation:
s
TlTu
Cm
*6
−
=
A machine capability index of Cm = 1.0 means that 99.73 % of all measured values lie with-
in tolerance. A value of Cm = 2.0 means that 99.9999998 % of all measured values lie with-
in tolerance.
The Cmk value also takes into account any systematic shift of all placement coordinates or
of the normal Gaussian distribution around a so-called mean (mean, x) in addition to the
standard deviation.
s
TlxxTu
Cmk
*3
),min( −−
=
Example:
c
m
<1,33
c
mk
<1,33
c
m
<1,33
c
mk
<1,33
c
m
>1,33
c
mk
<1,33
c
m
>1,33 c
mk
>1,33
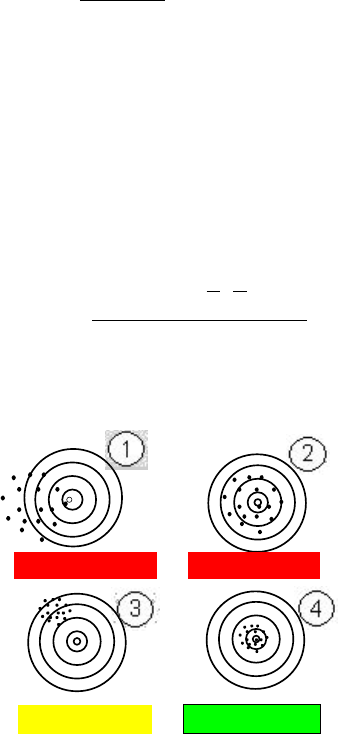
The figure on the left illustrates the significance
of the capability indices using hits on a shooting
target.
Target 1: Distribution of the individual values is
too large => Cm value < nominal.
A global offset of the individual values can also
be observed.
Target 2: Distribution of the individual values is
too large => Cm value > nominal. Although
there is only a small global offset, the large
distribution means that the specification cannot
be met.
If the Cm value is < nominal, the Cmk value can
also never be > nominal!
Target 3: Distribution of the individual values is
low. => Cm value > nominal.
The global offset, however, means that the Cmk
< nomianal. The specification is not met here
either.
Target 4: Distribution is low and the global
offset is minimal. => Cm value > nominal and
Cmk value > nominal. The specification was
therefore met.
The table below shows the relationships between the sigma values, the hit rate, the Cm and
Cmk values and the defect rate (dpm).
Tu = Upper tolerance threshold
Tl = Lower tolerance threshold
s = Standard deviation (at 1 sigma)
ASM AVS - USER MANUAL
PAGE 174 OF 182
The sigma value that is used by default when making specifications for SIPLACE placement
machines is highlighted in green in the table.
The table shows that a value of 4 sigma corresponds to a hit rate of 99.994%, a Cmk value of
1.33, and a dpm rate of 60.
Sigma
Hit rate
Cm; Cmk
Defect rate (dpm)
1
68.27 %
0.33
317300
2
95.45 %
0.66
45500
3
99.73 %
1
2700
4
99.994 %
1.33
60
5
99.99994 %
1.66
0.6
6
99.9999998 %
2.00
0.002
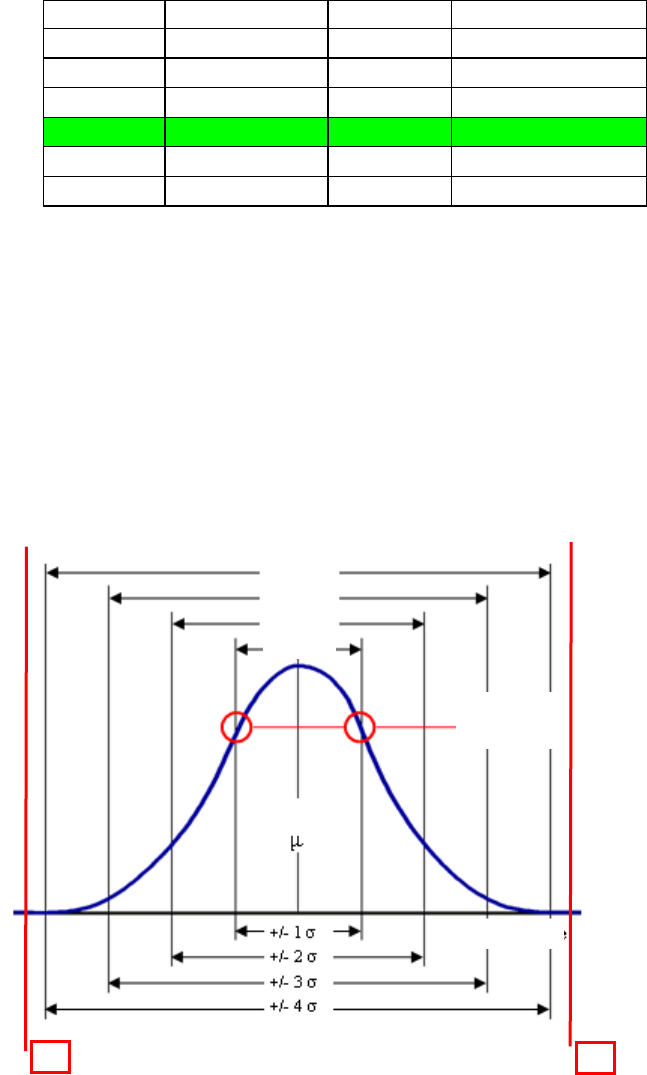
• Normal distribution, Gaussian bell curve
The diagram below shows a normal Gaussian distribution (bell curve). It illustrates the def-
inition of 1 sigma.
1 sigma lies precisely at the inflection point of the bell curve.
This means that 68.26 % of the area beneath the bell is covered, i.e. the hit rate is only
68.26 %.
If you now continue to add the same distance in both directions, you arrive at 2, 3, 4 sigma
etc. and the hit rate increases correspondingly.
Tl
Mean value
Measured values
Inflection
points
99.994 %
99.73 %
95.44 %
68.26%
Tu
ASM AVS - USER MANUAL
PAGE 175 OF 182
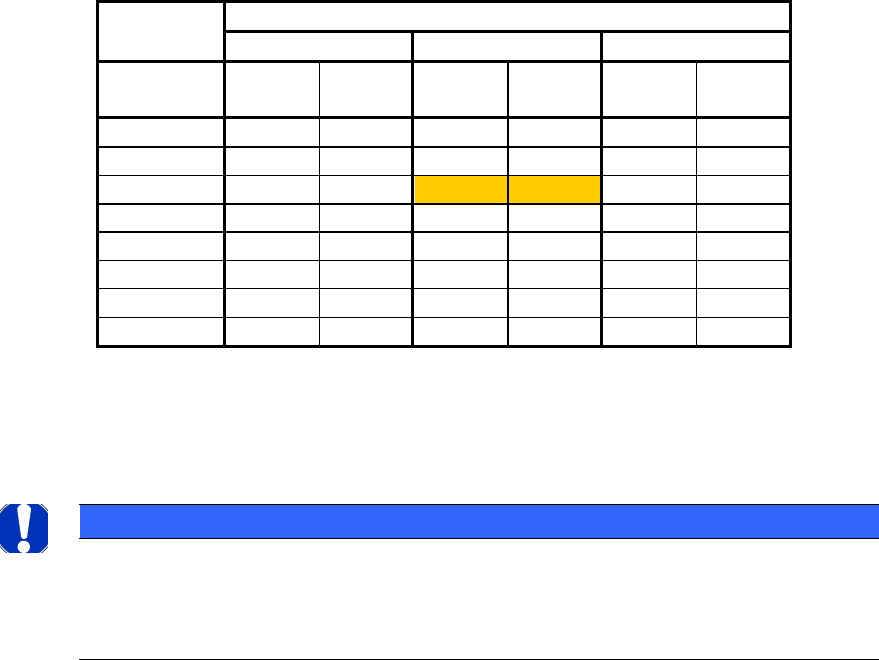
• Confidence intervals for the capability indices
When creating a measurement plan (recipe), the confidence intervals must be taken into
consideration when taking a decision about the number of components placed per place-
ment head.
Explanation:
Because the capability indices (Cm, Cmk) are calculated on the basis of random samples, it
must be assumed that these are randomly influenced within certain limits, and therefore
represent an estimation.
This influence is specified by means of confidence intervals.
The confidence interval expresses the degree to which the calculated Cm or Cmk value can
very depending on the size of the random sample at an assumed probability of 95 %.
The table above shows the confidence intervals (Cmk
l
through
cmk
u
)
depending on the size of the random sample.
NOTICE
Because measurements are only taken with random samples of < 50 components per individual head in
most of the standard machine capability analyses, the confidence interval with reference to the "Number
of measured values" must be taken into account when evaluating the results of the measurement (calcu-
lated Cmk value). A result should therefore only be deemed GOOD if it is significantly above cmk
u
Cm value, Cmk value
1
1.33
1.67
Number of
values
Cmk
l
Cmk
u
Cmk
l
Cmk
u
Cmk
l
Cmk
u
20
0.71
1.29
0.95
1.71
1.21
2.13
40
0.79
1.21
1.07
1.59
1.35
1.99
50
0.82
1.18
1.1
1.56
1.38
1.96
75
0.85
1.15
1.14
1.52
1.44
1.9
100
0.87
1.13
1.17
1.49
1.47
1.87
200
0.91
1.09
1.21
1.45
1.53
1.81
500
0.94
1.06
1.26
1.4
1.58
1.76
1000
0.96
1.04
1.28
1.38
1.61
1.73