3_AVS-V2_MCT-UM-internal_EN_07-2019.pdf - 第126页
ASM AVS - U SER M ANUAL P AGE 126 OF 182 5.3.2.3 »Current Results«, selecting the result display To If t he » All Mea su reme nts « s wit ch is ac tiva te d t hen al l the mea sur emen ts in t he p roje ct a re sum mar i…
ASM AVS - USER MANUAL
PAGE 125 OF 182
5.3.2.2 »Current Results« after a measurement:
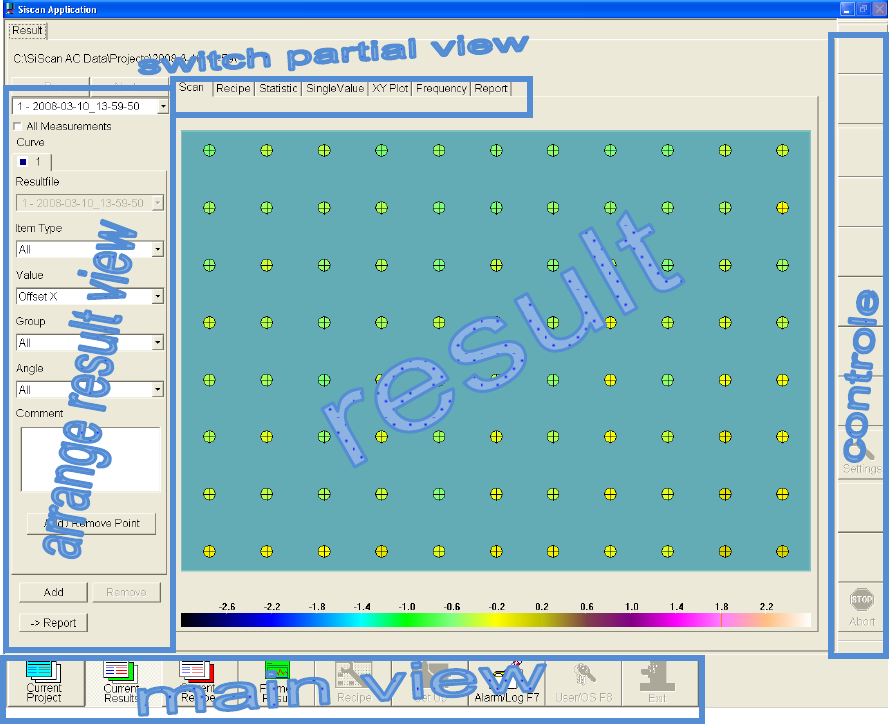
When the measurement is finished, the »Live Image« tab is hidden. Instead, you see six new
tabs, thus resulting in the following screen:
• In the »Choose result display« area (left), you can filter the results displayed in the »Result«
area.
• In the top area »Switch to partial view«, you can choose the type of analysis for the display
in the »Results« area.
• In the »Control« area (right), various buttons are provided for the individual views.
• In the »Main view« area (bottom), you can switch between project control, the result view,
recipe view and the error log.
ASM AVS - USER MANUAL
PAGE 126 OF 182
5.3.2.3 »Current Results«, selecting the result display
To If the »All Measurements« switch is activated then all the measurements in the project are
summarized in a single result. All the statistical values are then calculated and displayed using
this multiple basis.
To The individual results are displayed as tabs with colored and symbolic labels.
For all views apart from »Single Value« (single value chart) and »XY Plot«, the active tab is re-
sponsible for the display in the »Results« area.
In the two above-mentioned graphical display modes, this result tab can be used to construct a
result chart with up to 6 different graphs.
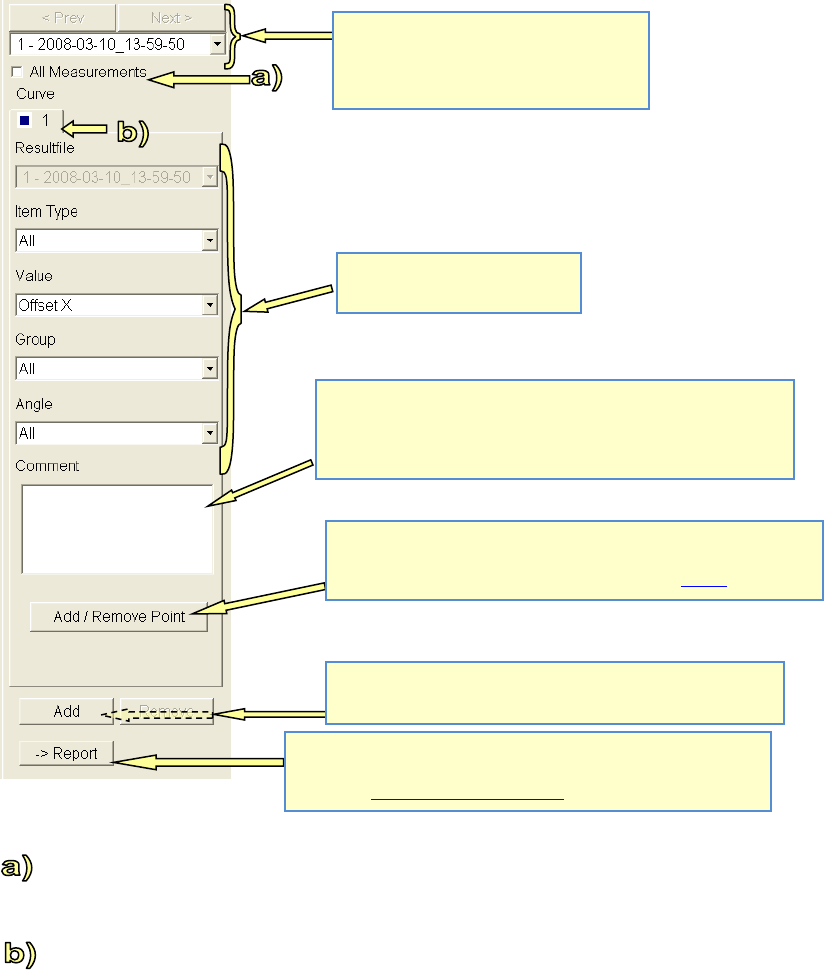
Switches between the individual project
measurements.
The measurement chosen here is used as
the basis for Graph 1!
Filter options for the display in
the result view:
You can add a comment for the corresponding measurement here.
This makes it possible to manage a project history.
This comment is an internal comment! It is not possible to show
this comment in the report!
The "Add / Remove Point" button is only active in Scan view!
This makes it possible to eliminate any outliers, for example due to
dirt on the board, or restore such points. See also 4.3.2.4
Click the "Add" button to add a further analysis (e.g. another
graph). "Remove" removes it again.
When you click on the "-> Report" button, the exact screen dis-
played in the results area is taken over into the report. (e.g. screen-
shot). See 4.3.2.10 »Current Results« – »Report«:
ASM AVS - USER MANUAL
PAGE 127 OF 182
5.3.2.4 »Current Results«, »Scan view«
The Scan view has already been presented in the previous sections.
The present section simply indicates certain special characteristics of this view.
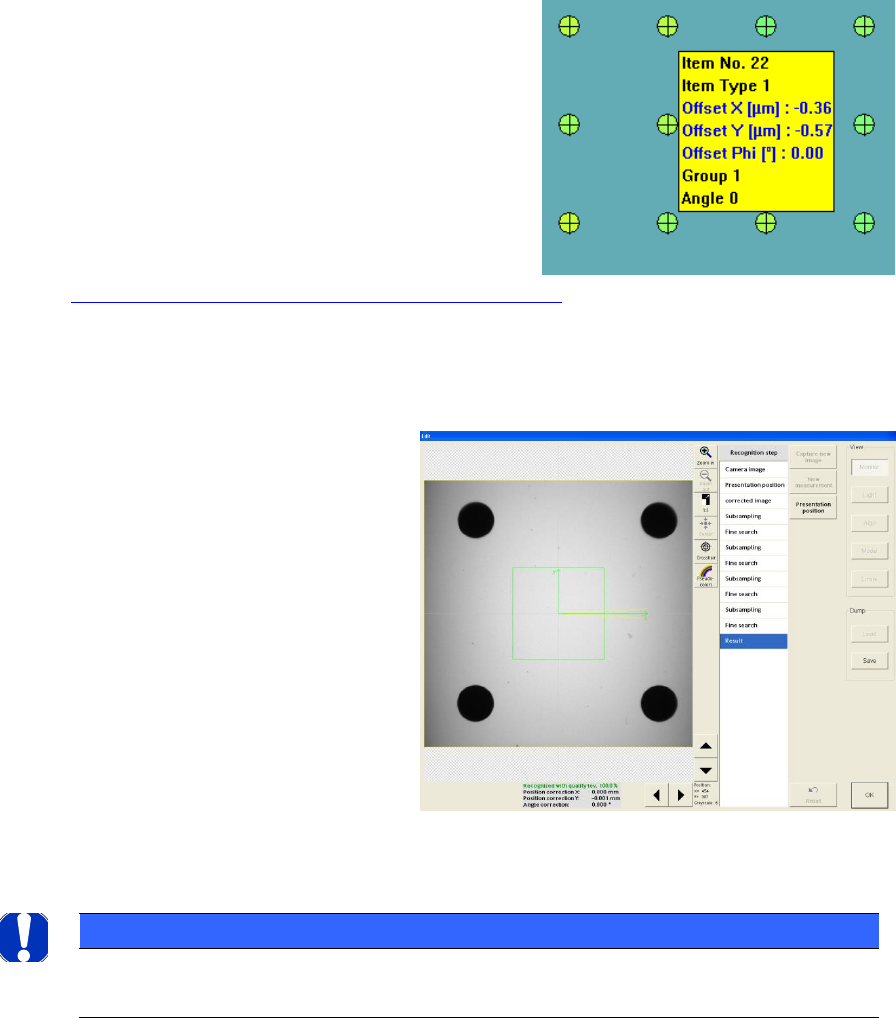
5.3.2.4.1 Detailed information on the measurement points
If you move the mouse over a colored point in
the result view then you will see a pop-up menu
containing detailed information on the corre-
sponding measurement point.
In this way, it is also possible to determine the
number of the measurement point, for example
in order to remove a measurement point from
the result.
See »Add/Remove Point« in
4.3.2.3 »Current Results«, selecting the result display.
5.3.2.4.2 Viewing Vision dumps
When you click on the correspond-
ing measurement point (colored
circle), the system switches to the
Siplace Vision software and the cor-
responding Vision dump is dis-
played.
In this way, it is possible, for exam-
ple, to examine a point that was not
measured or was measured badly
and draw conclusions concerning
the measurement result
NOTICE
Due to the large data volumes involved, the Vision dumps are only stored temporarily and are only availa-
ble for the last "current" measurement.