3_AVS-V2_MCT-UM-internal_EN_07-2019.pdf - 第178页
ASM AVS - U SER M ANUAL P AGE 178 OF 182 NOTICE The sequence of the measurement is fully reflected in the "Single Value Chart". You should therefore take into account the measurement sequence when in terpreting…
ASM AVS - USER MANUAL
PAGE 177 OF 182
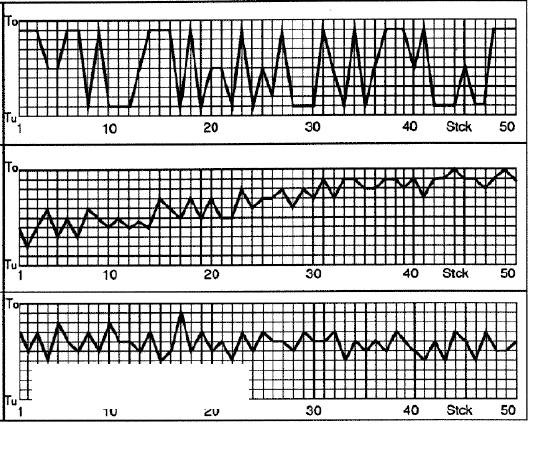
7.4.2 Notes on evaluating the Single Value chart:
The first thing to consider when evaluating the chart is whether a normal distribution is shown.
(1) Normal distribution?
a) Chaotic distribution:
The measured values jump chaotically between a few values.
This means that the individual values are not normally distributed. The machine is not
deemed capable.
b) Normal distribution with a trend:
The measured values follow a trend that indicates systematic influences on the process. The
process must be stabilized, for instance by mapping.
c) Normal distribution without a trend:
The measured values are randomly distributed around a constant mean value, allowing the
measured values to be evaluated statistically and the machine capability indices to be de-
termined.
a)
b)
c)
T
u
: upper tolerance limit
Tu: lower tolerance limit
To: upper tolerance limit
ASM AVS - USER MANUAL
PAGE 178 OF 182
NOTICE
The sequence of the measurement is fully reflected in the "Single Value Chart". You should therefore take
into account the measurement sequence when interpreting the chart.
See also 4.3.5.3.8 Adjustment of measurement sequence.
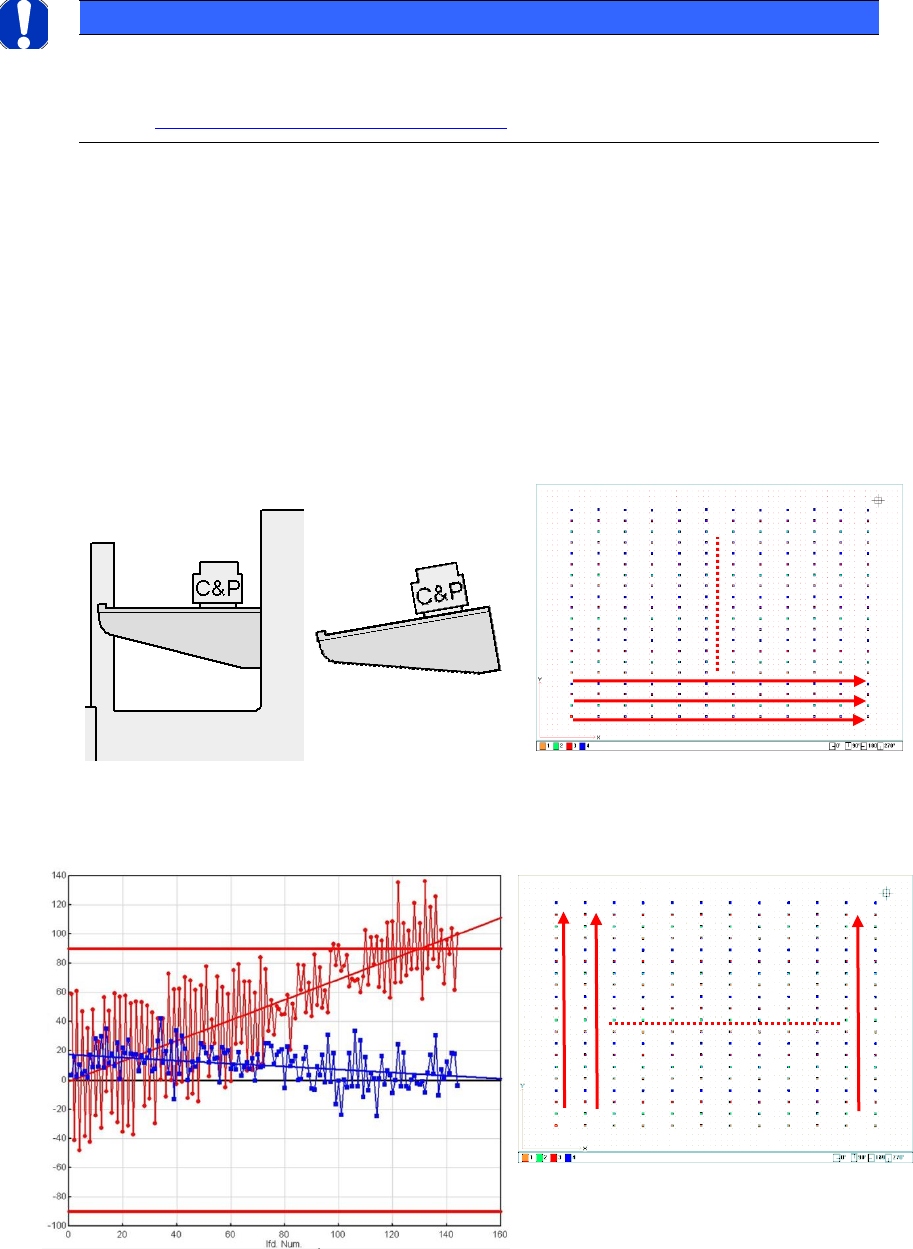
(2) Trend mapping?
When interpreting trends in particular, attention must be paid to the relationship between
the placement sequence and the measurement sequence.
Assumptions:
The gantry is positioned obliquely in Y.
The head has rolled over the star in X. Thus, if you view the board from above, the compo-
nents were placed from lef-t to right in one head cycle.
The next head cycle follows in an upward direction.
If the measurement was performed column-by-column and without changing direction, the
result is as follows.
Portalverzug
Measuring sequence
Measuring sequence
ASM AVS - USER MANUAL
PAGE 179 OF 182
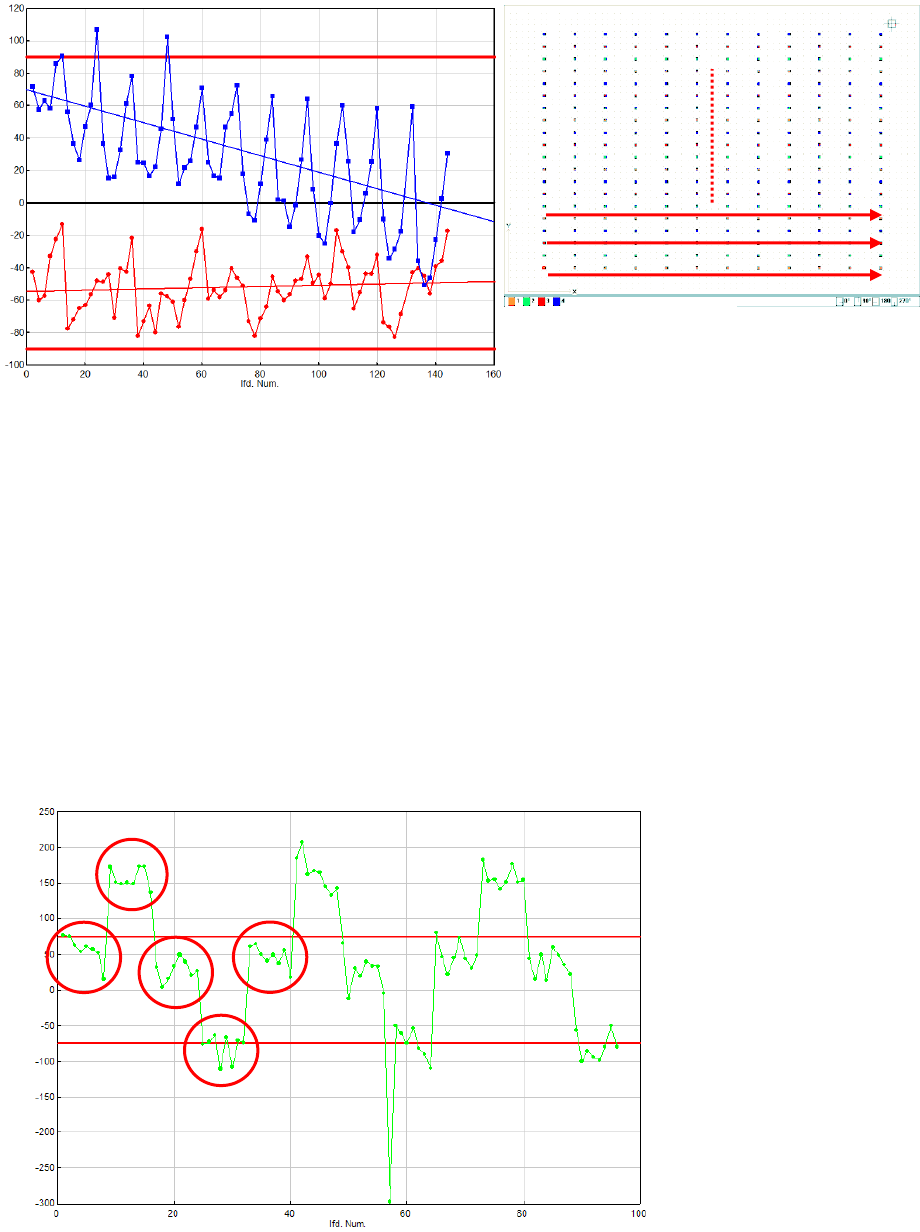
If, however, measurement is performed row-by-row without any change in direction, the
global trend of the individual values is overlaid by a further trend within a head cycle.
One could conclude from this that the segment offset on the head is not calibrated correct-
ly, but the measurement sequence in Y causes the rising value of the Y offset resulting from
the angle of the gantry to increase with every measurement in a head cycle, to then return
to the minimum value at segment 1 (left).
This results in a saw-tooth pattern.
(3) Trend for a segment offset?
The chart below shows a typical curve for a segment offset on a 12-segment C&P head.
The groups of individual measurements placed by one segment can be clearly seen. An "out-
lier" can also clearly be seen on segment 8.
Measuring sequence