1.011.1_VPC使用手册.pdf - 第12页
11/144 on a specific machine or inspection plan, unlike Type 3, which uses the basic set of the total inspected solder joints. Type 7 Repeatability Normal distribution Type 7 displays the normal distribution of the featu…
10/144
Type 3
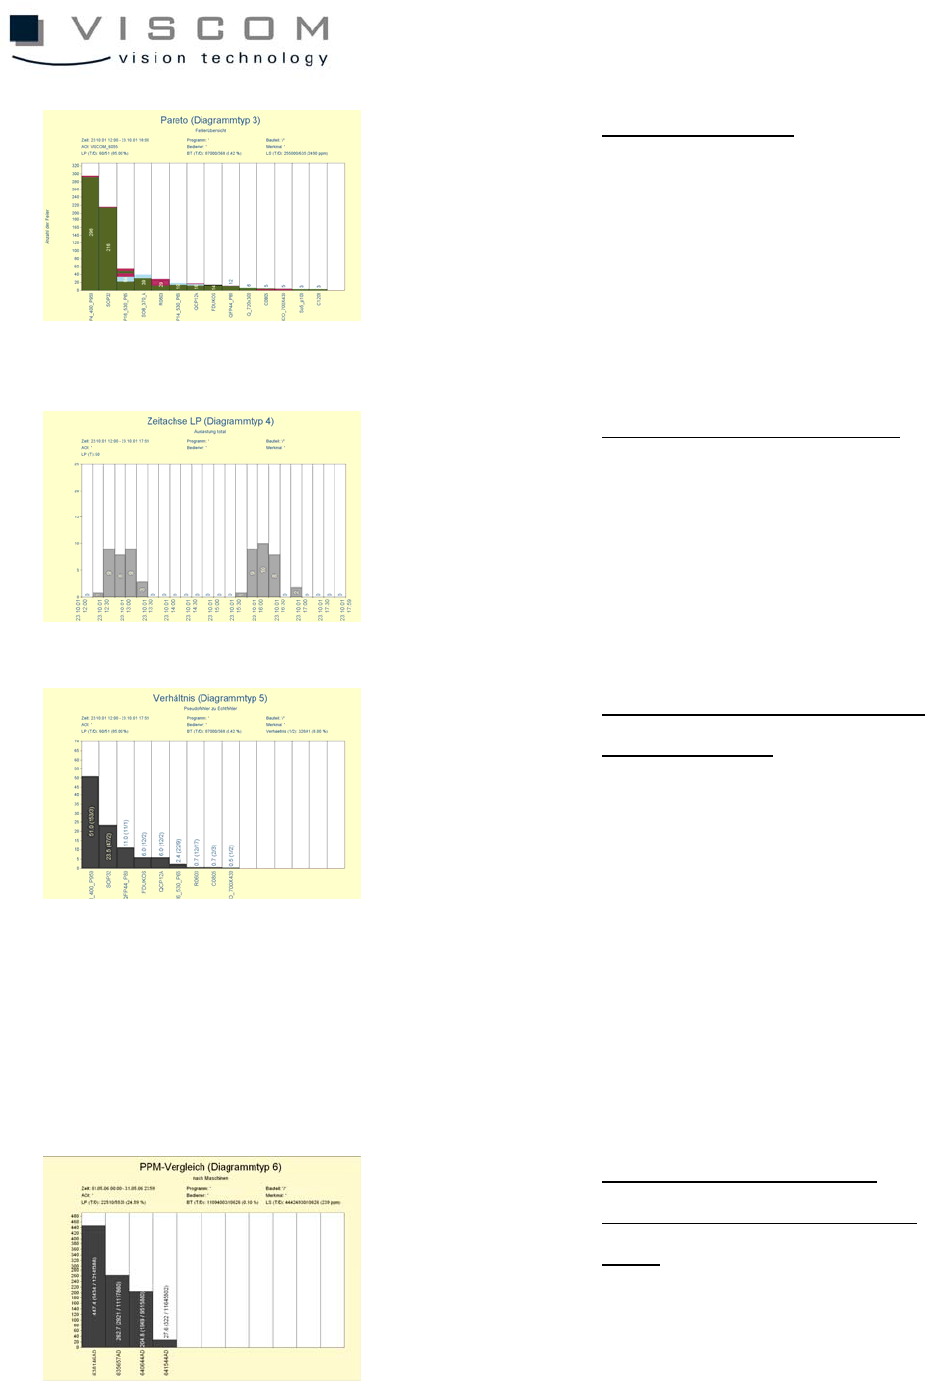
Pareto
Defect distribution
The Pareto diagram indicates
the frequency distribution of
the classified analysis results.
There are different
possibilities for scaling the X-
and Y-axes.
Type 4
Timeline (PCB)
Defect distribution over time
Diagram type 4 allows the
presentation of PCB-related
feature values over a timeline.
Type 5
Ratio
Ratio between pseudo defects
and real defects
Type 5 is a diagram that
shows the proportion of defect
features to one another. The
evaluation can be based on
the component ID or body
type and supports the Pareto
diagram (type 3) during
effective program
optimization.
Type 6
PPM
Comparison
Individual PPM rates from
single machines or inspection
plans
Type 6 calculates the PPM
rates for the individual bars
using the actual number of
failed inspected solder joints
11/144
on a specific machine or
inspection plan, unlike Type 3,
which uses the basic set of
the total inspected solder
joints.
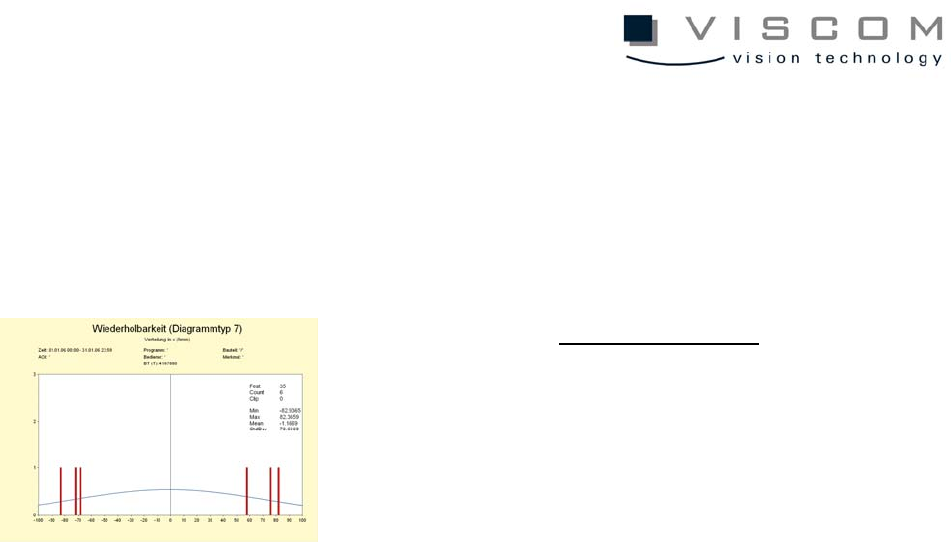
Type 7
Repeatability
Normal distribution
Type 7 displays the normal
distribution of the feature
values as standard deviation
or average value.
12/144
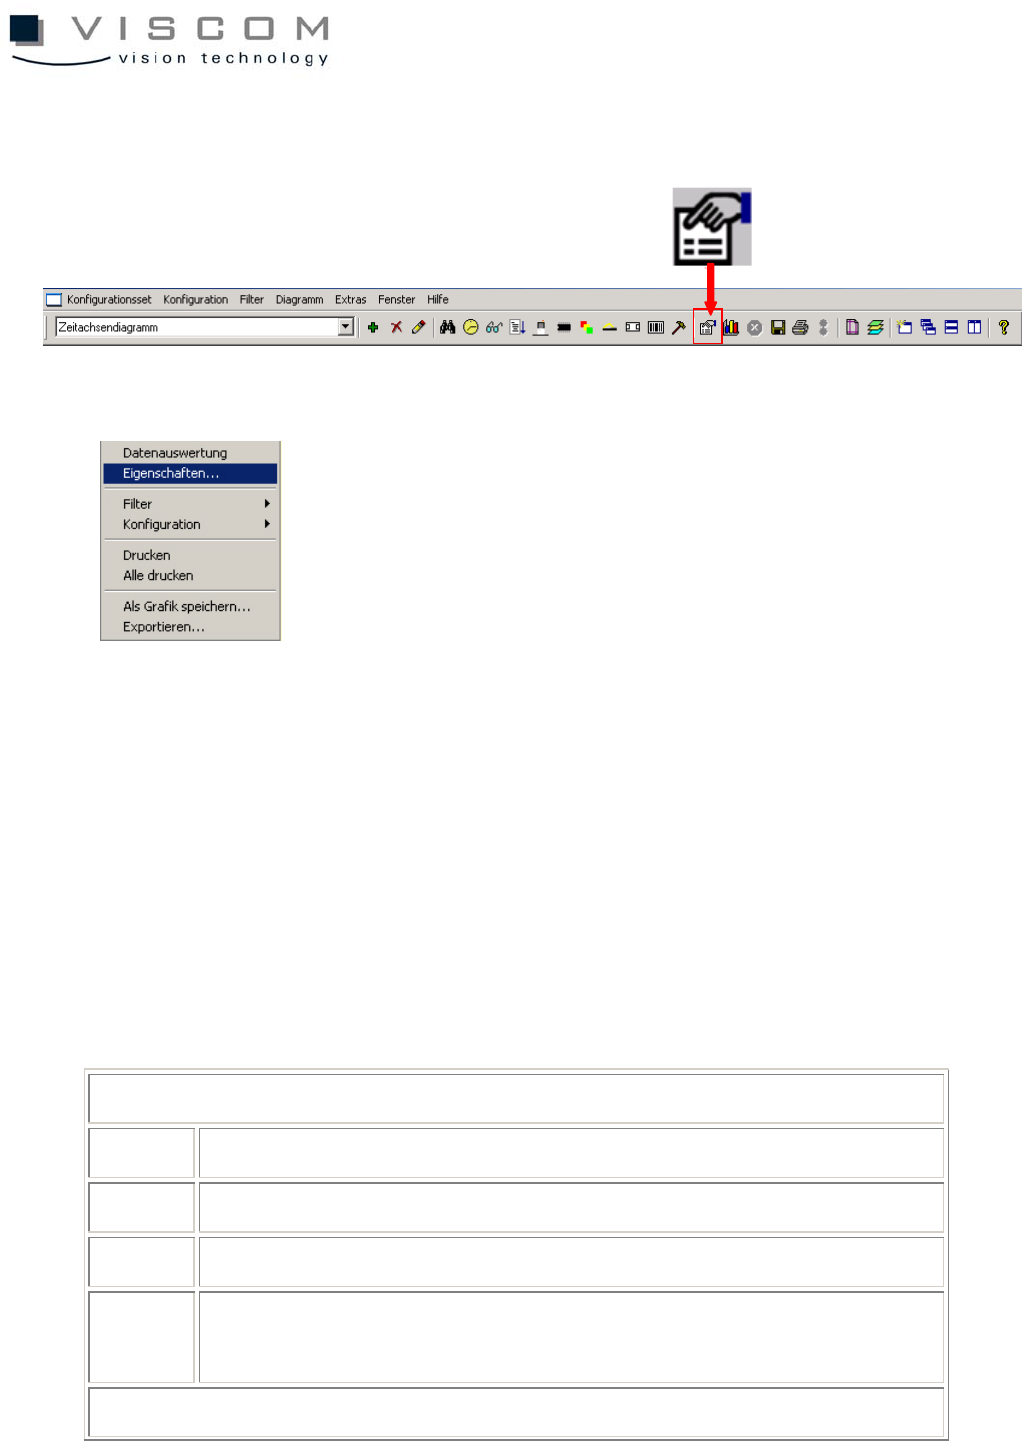
1.3 Diagram Properties
The diagram properties can be called up at any time by using the icon in the
menu bar or with a right mouse click in the diagram.
They are divided into an upper and lower portion. The lower part is different
depending on the chosen diagram type (diagram types 0-7).
The upper part is again divided into three file tabs: General, Text Font and
Color, Files; it is identical for all diagram types, briefly explained as follows.
Level "General"
1 selection of diagram type
2 title and subtitle of the diagram
3 X- and Y-axis designation
4 options: selection if the statistics in the diagram header should be
for single panels or the entire PCB
Level "Text Font and Color"