1.011.1_VPC使用手册.pdf - 第70页
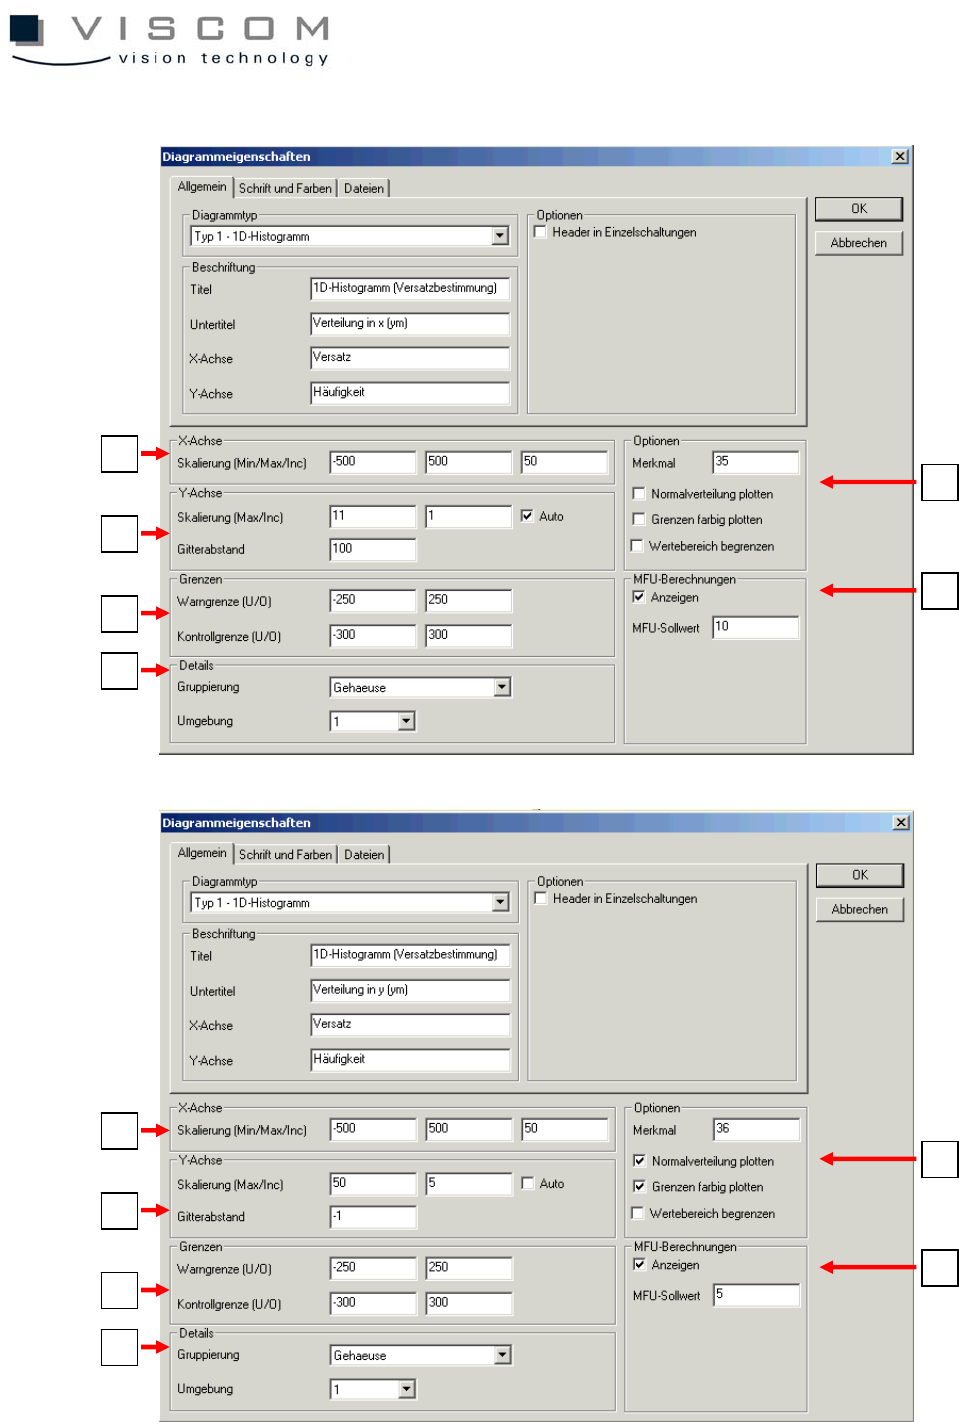
69/144 1 X-axis 2 Y-axis 3 limits 4 details 5 options 6 MFU calculation The data evaluation shows a double diagram: on the left appears the X- distribution (without color ed limits), and on the right t he Y-distribution …
68/144
1
2
3
4
5
6
1
2
3
4
5
6
69/144
1 X-axis
2 Y-axis
3 limits
4 details
5 options
6 MFU calculation
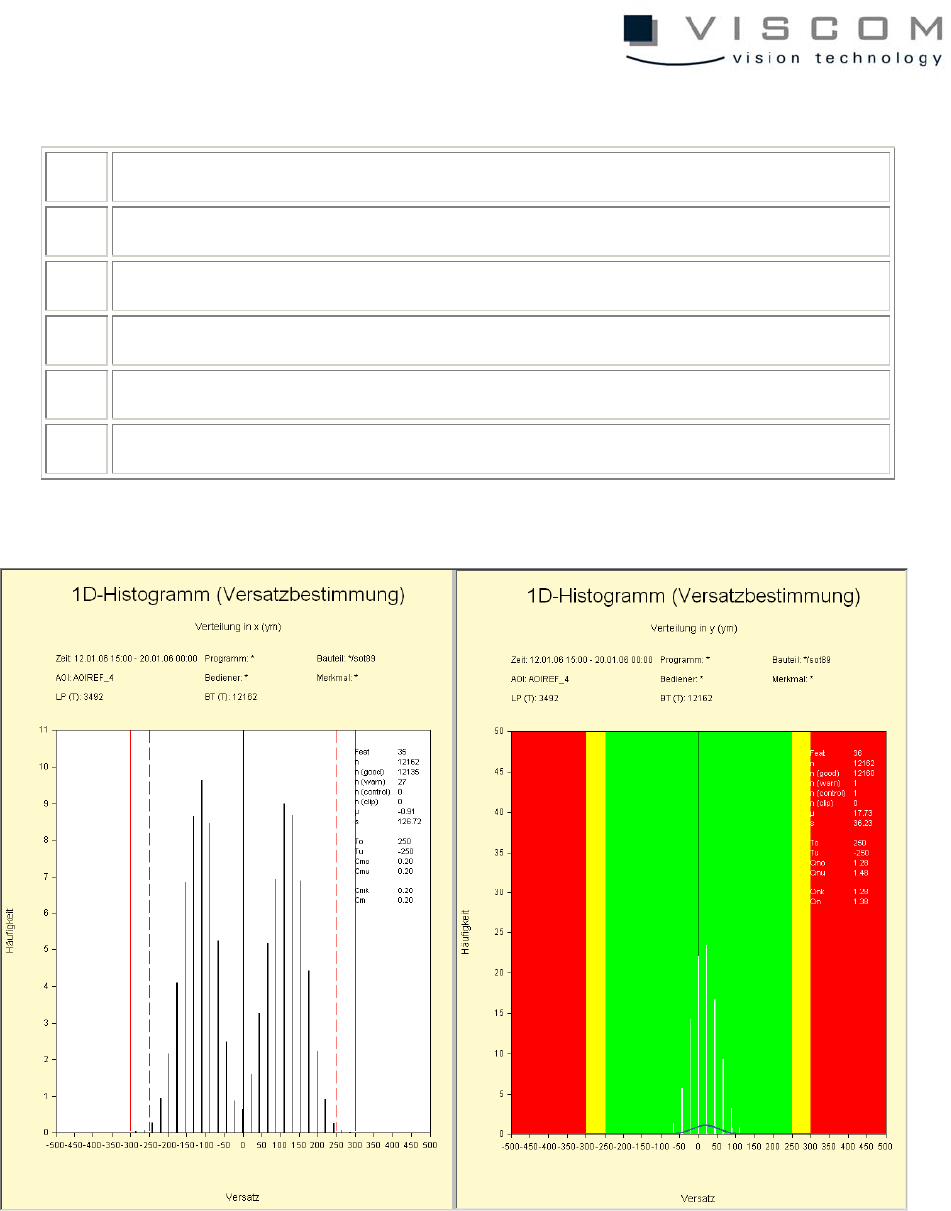
The data evaluation shows a double diagram: on the left appears the X-
distribution (without colored limits), and on the right the Y-distribution (with
colored limits).
The diagram contains some additional measurement values that result from the
diagram.
70/144
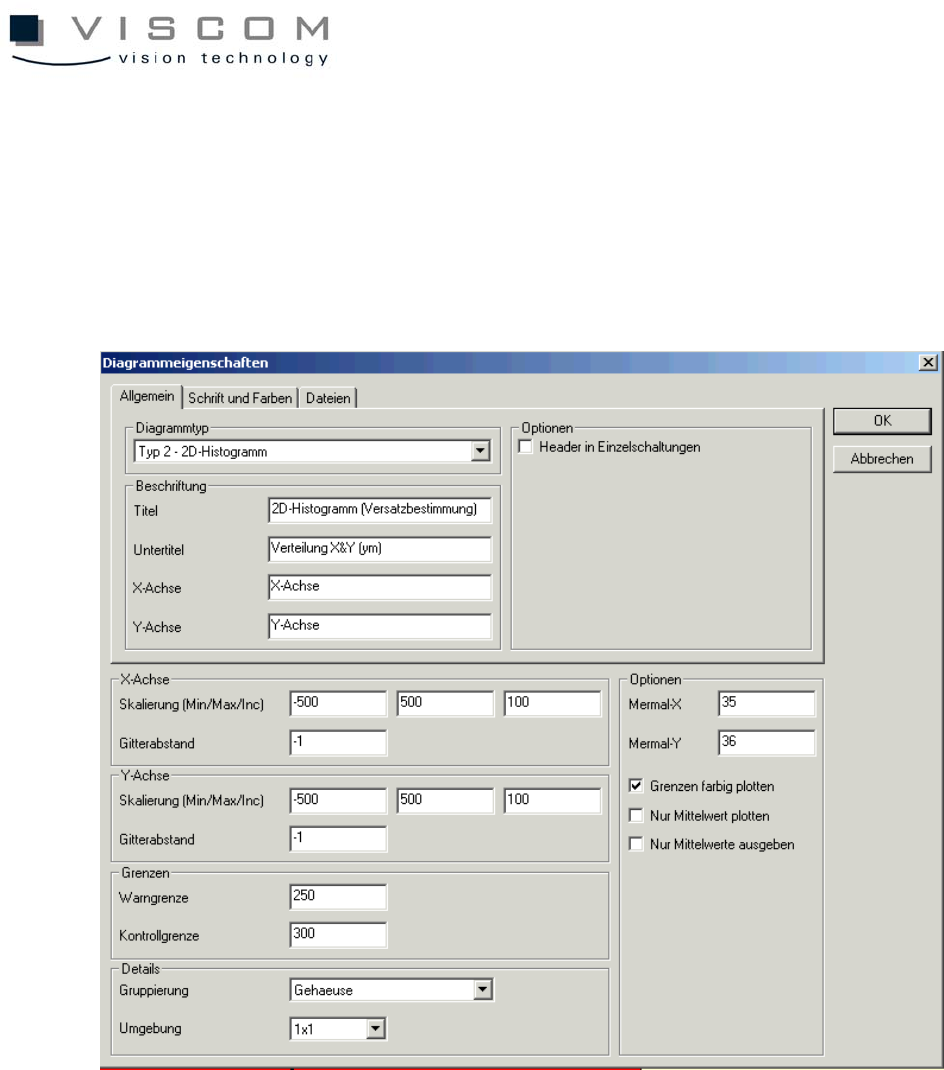
3.2.5 Data evaluation by determining two-dimensional displacement
Diagram type 2 is the third and last possibility. This evaluation functions like the
previous diagram type 1, except the display here is two-dimensional, so
displacement can be shown on two axes at the same time.