1.011.1_VPC使用手册.pdf - 第9页
8/144 Help displaying the current VPC version and calling up Online Help
7/144
1. Using the VPC Software
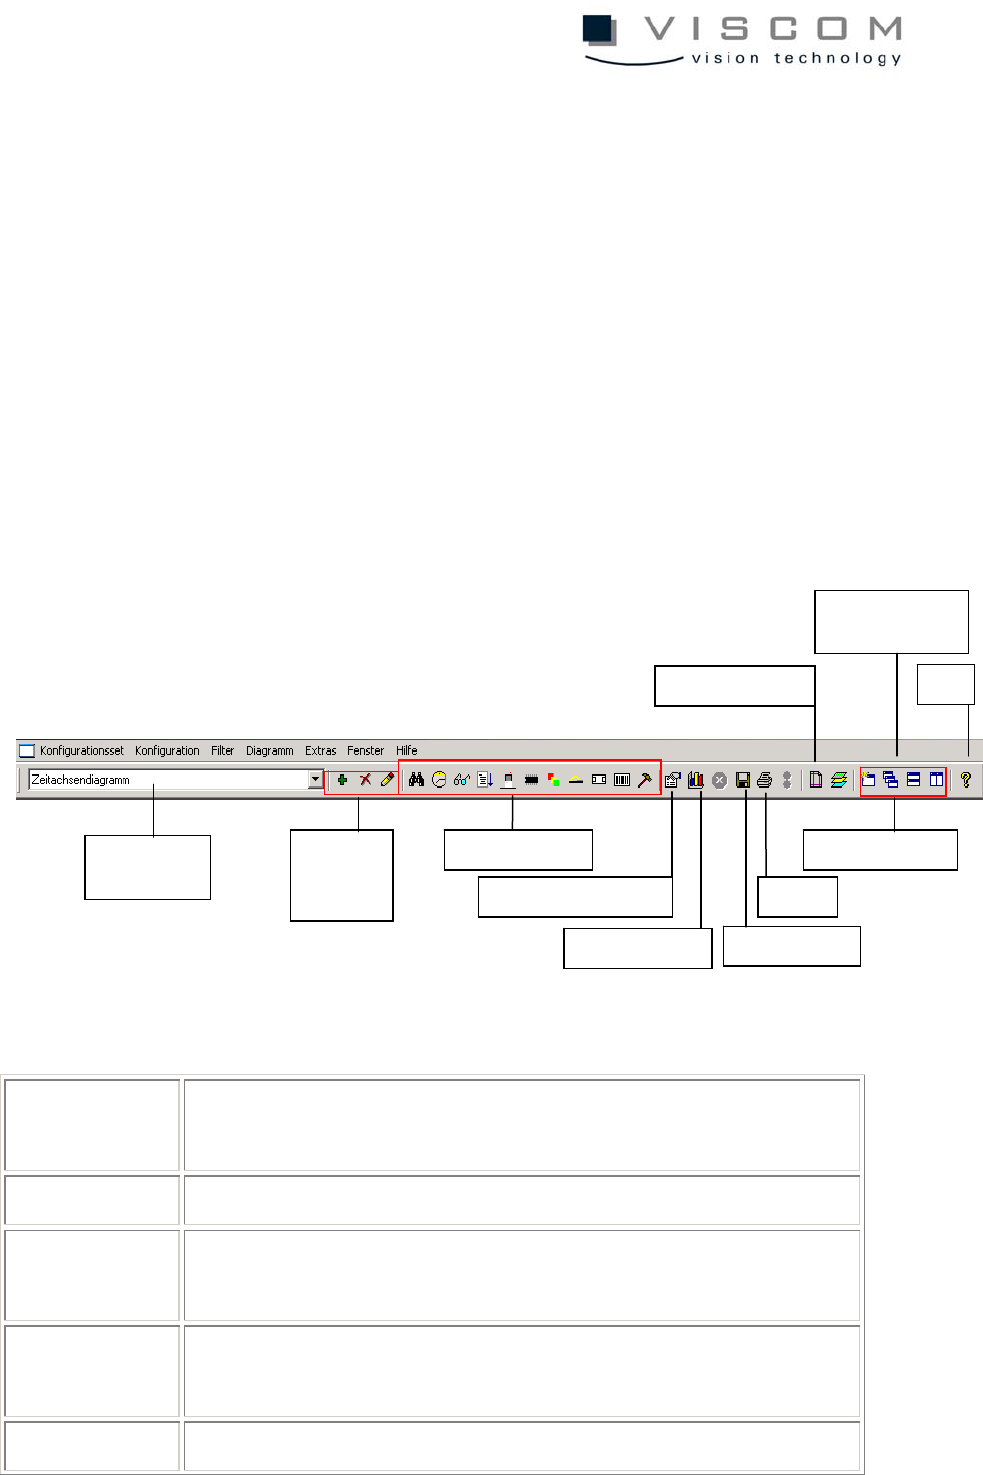
1.1 Menu Bar
Processing the configurations - called diagrams in the following - and the
configuration sets (which can contain 1-6 or 9 diagrams) can be done in three
different modes:
• icons
• menu bar
• right mouse click in the analysis area.
A detailed description of the menu bar is given in the following:
Configuration
set
editing the entire configuration set
Configuration editing the currently selected diagram
Filter editing the filter settings for the current diagram or for the
entire configuration set
Diagram editing the diagram properties; data evaluation of the current
diagram
Extras data evaluation and printer setup
Configuration
set selection
Delete,
add, edit
entries
Filter icons
Diagram properties
Data evaluation
Save graphics
Print
Window
Printer setup
Automatic data
evaluation
Help
8/144
Help displaying the current VPC version and calling up Online
Help
9/144
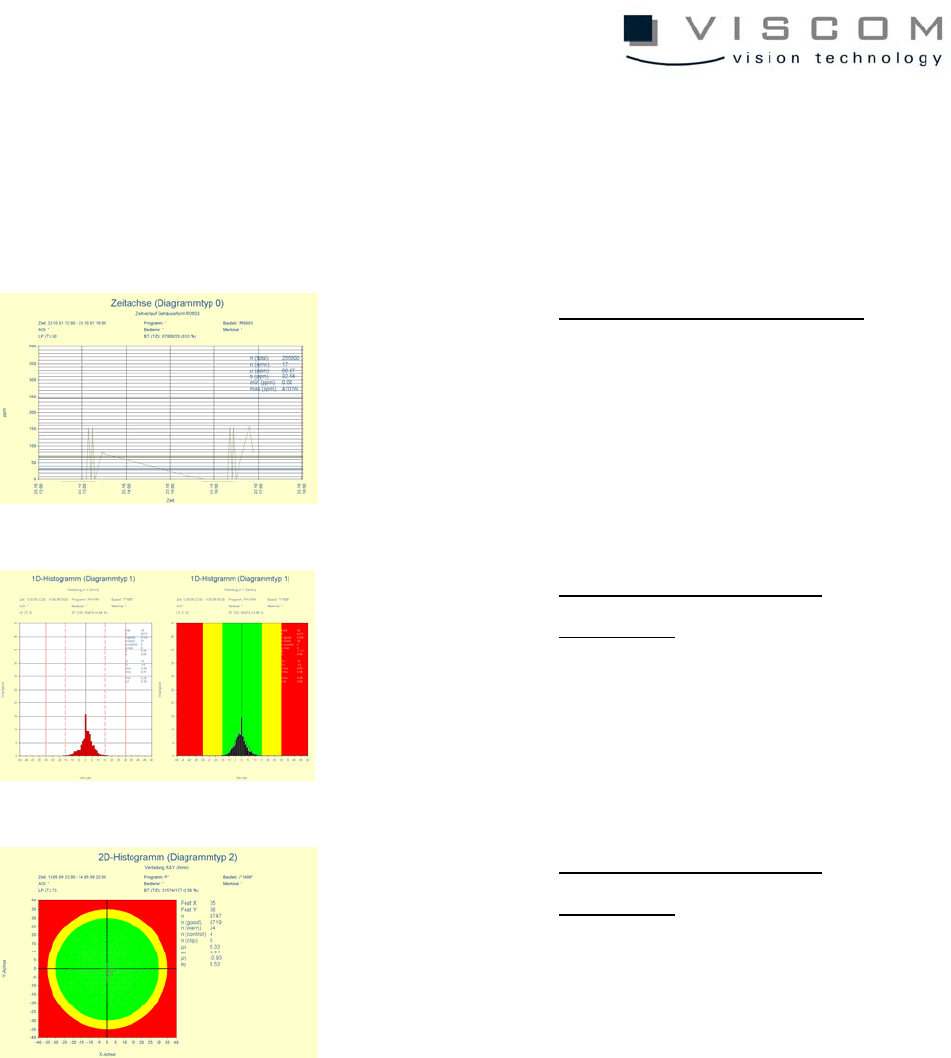
1.2 Diagram Types
Currently, there are 8 different diagram types that are fully explained step by
step later. Here is a short overview for orientation.
Type 0
Timeline
Feature evaluation over time
Diagram type 0 displays
feature values over time.
Type 1
1D Histogram
One-dimensional feature
distribution
Diagram type 1 shows a one-
dimensional diagram of the
frequency distribution of the
individual feature values.
Type 2
2D Histogram
Two-dimensional feature
distribution
In diagram type 2, X and Y
displacement features are
displayed in a two-
dimensional diagram.