1.011.1_VPC使用手册.pdf - 第43页
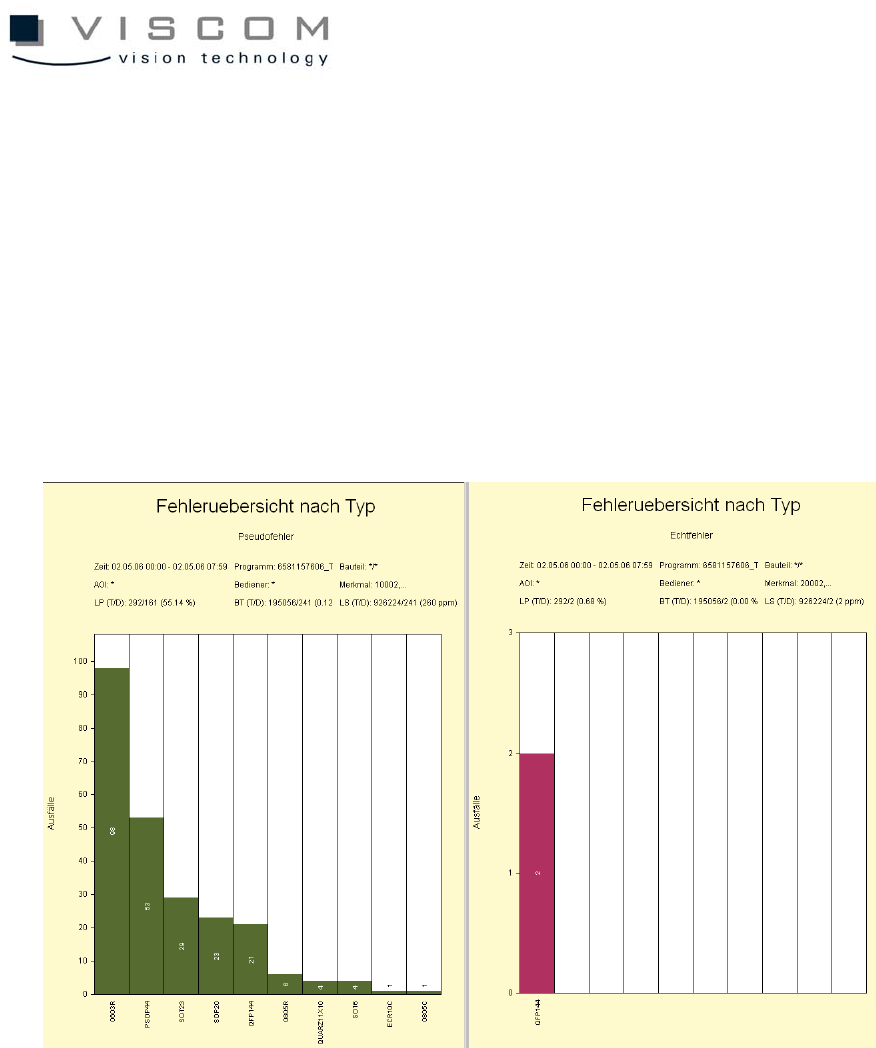
42/144 After a short evaluation time, a new conf iguration set with two Pareto diagrams opens automatically. These templates are pr e-configured diagrams that can be called up from other diagrams. The vp c.template file …
41/144
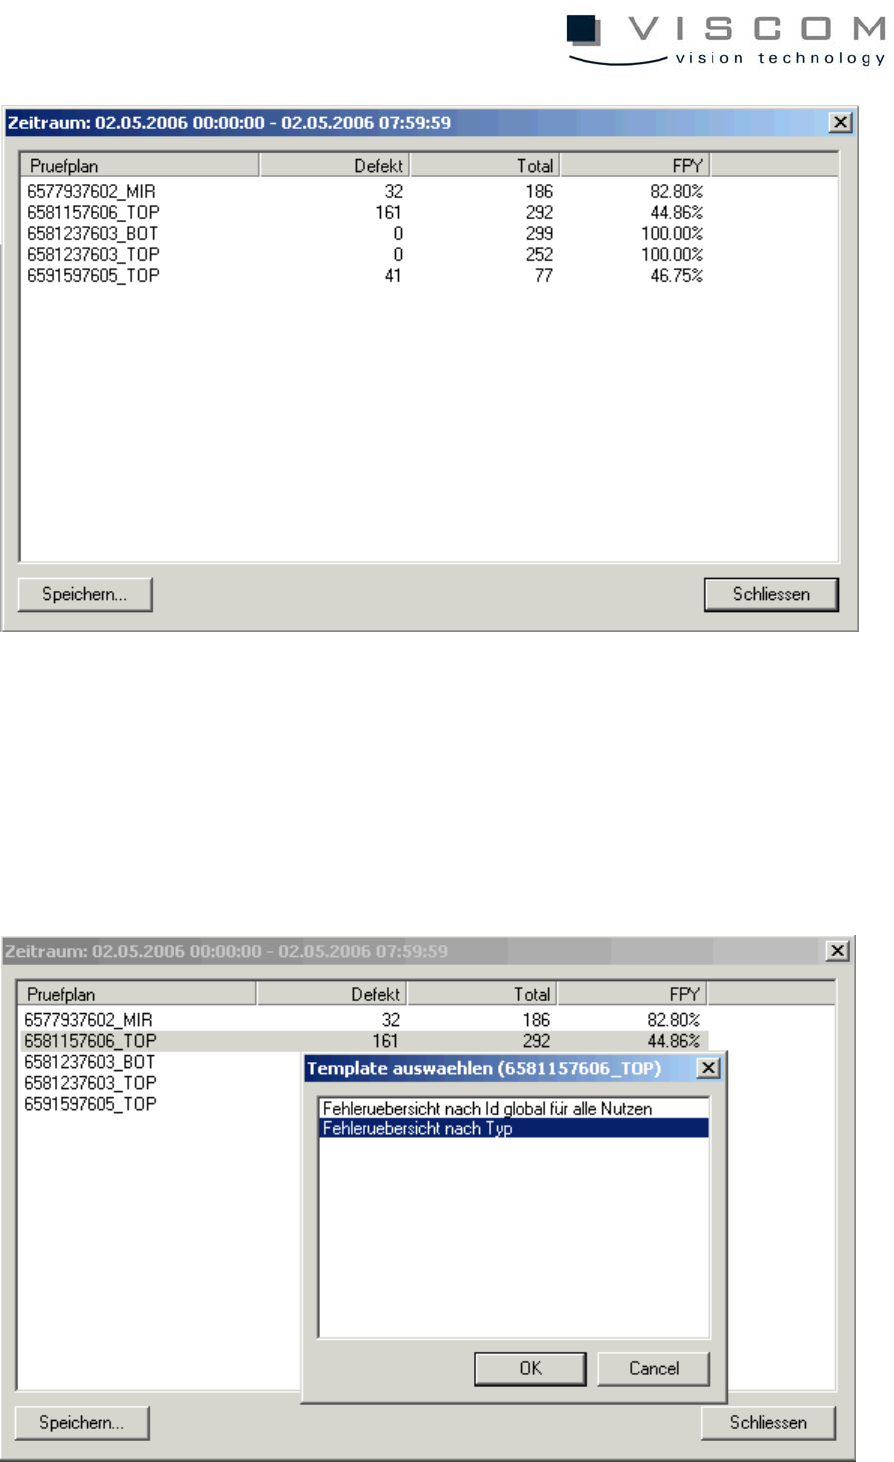
To find out which component body type caused the rather high defect rate of
55.14% in inspection plan 2147483647_TOP, this is to be marked (see above).
A double left mouse click brings the following image.
Here, the point "Error overview by type" is chosen and confirmed with the "OK"
button.
42/144
After a short evaluation time, a new configuration set with two Pareto diagrams
opens automatically. These templates are pre-configured diagrams that can be
called up from other diagrams. The vpc.template file underlies them, the
possible branchings can be configured here (see appendix for a more detailed
description).
These files should only be edited by experienced users, otherwise faulty results
or a loss of functions in the cascaded evaluations may result.
In these diagrams, it can be seen that the time filter as well as the inspection
plan filter are automatically taken over from the time axis diagram.
Both templates are preconfigured so that the pseudo defects are seen on the
left side and the real defects, on the right.
This display always makes sense during optimization, to observe not only the
inspection patterns with regard to the pseudo defects they produce, but also
their effectiveness in relation to real defect recognition.
In our example the component type 0603R is to be optimized as TOP 1.

43/144