1.011.1_VPC使用手册.pdf - 第68页
67/144 3.2.4 Data evaluation by determining one-di mensional displacement Diagram type 1 offers another possibility fo r display. With i t, the displacement value of a component can be displayed as a Gauss curve, for exa…
66/144
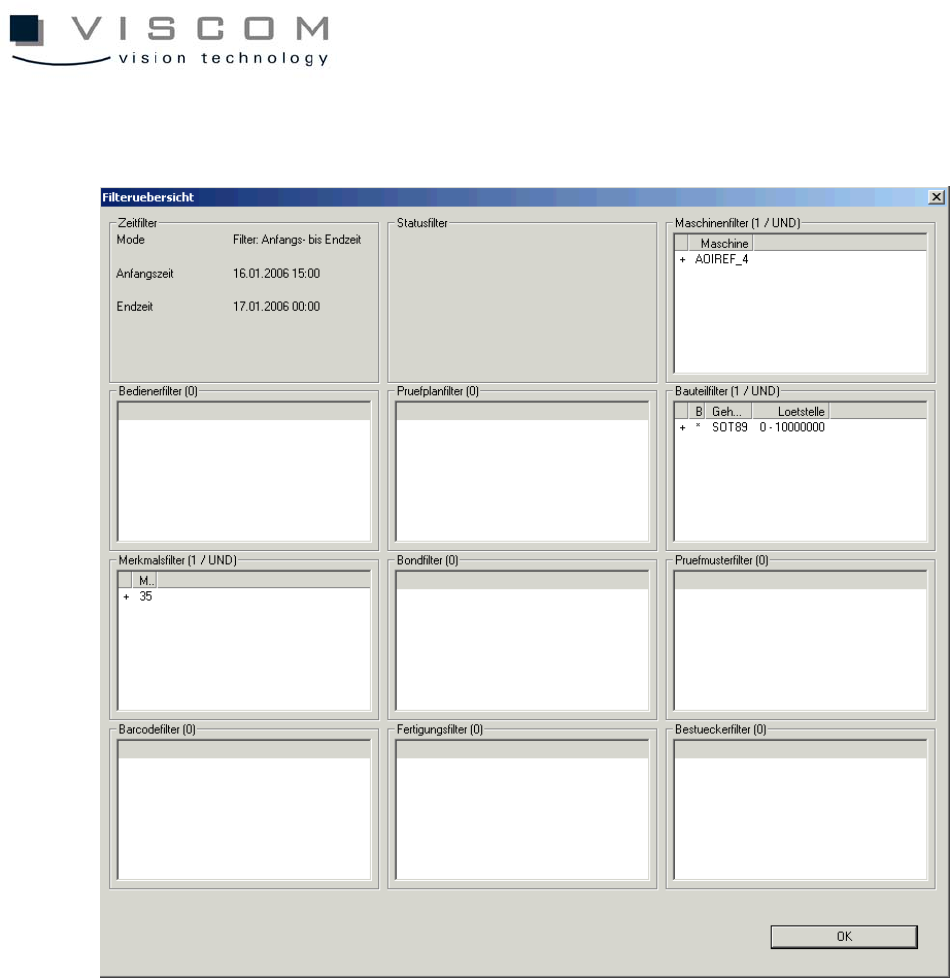
The filter overview shows the following filter settings.
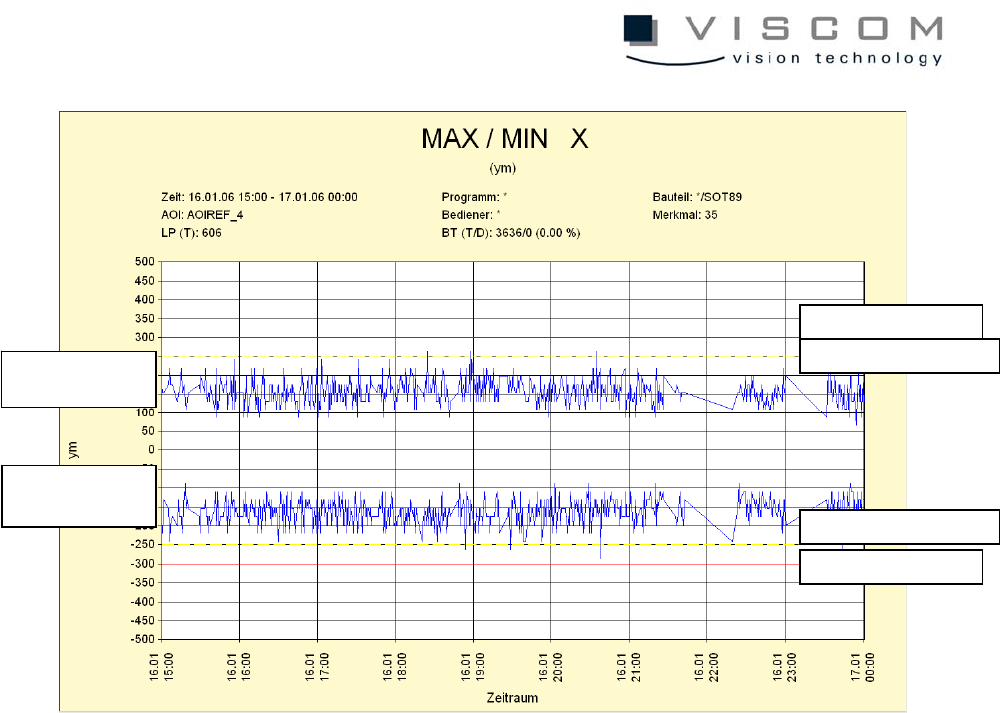
3.2.3 Data evaluation minima/maxima
A click on "Data evaluation" brings up the following image:
There are two blue graphs to indicate the minimum (negative) and maximum
(positive) deviations from the recorded feature values within the evaluation
period.
The warning limit (red line) and the control limit (yellow dotted line) can be seen
for the minimum as well as for the maximum.
The header reads out the number of PCBs, the number of components and the
filters used.
67/144
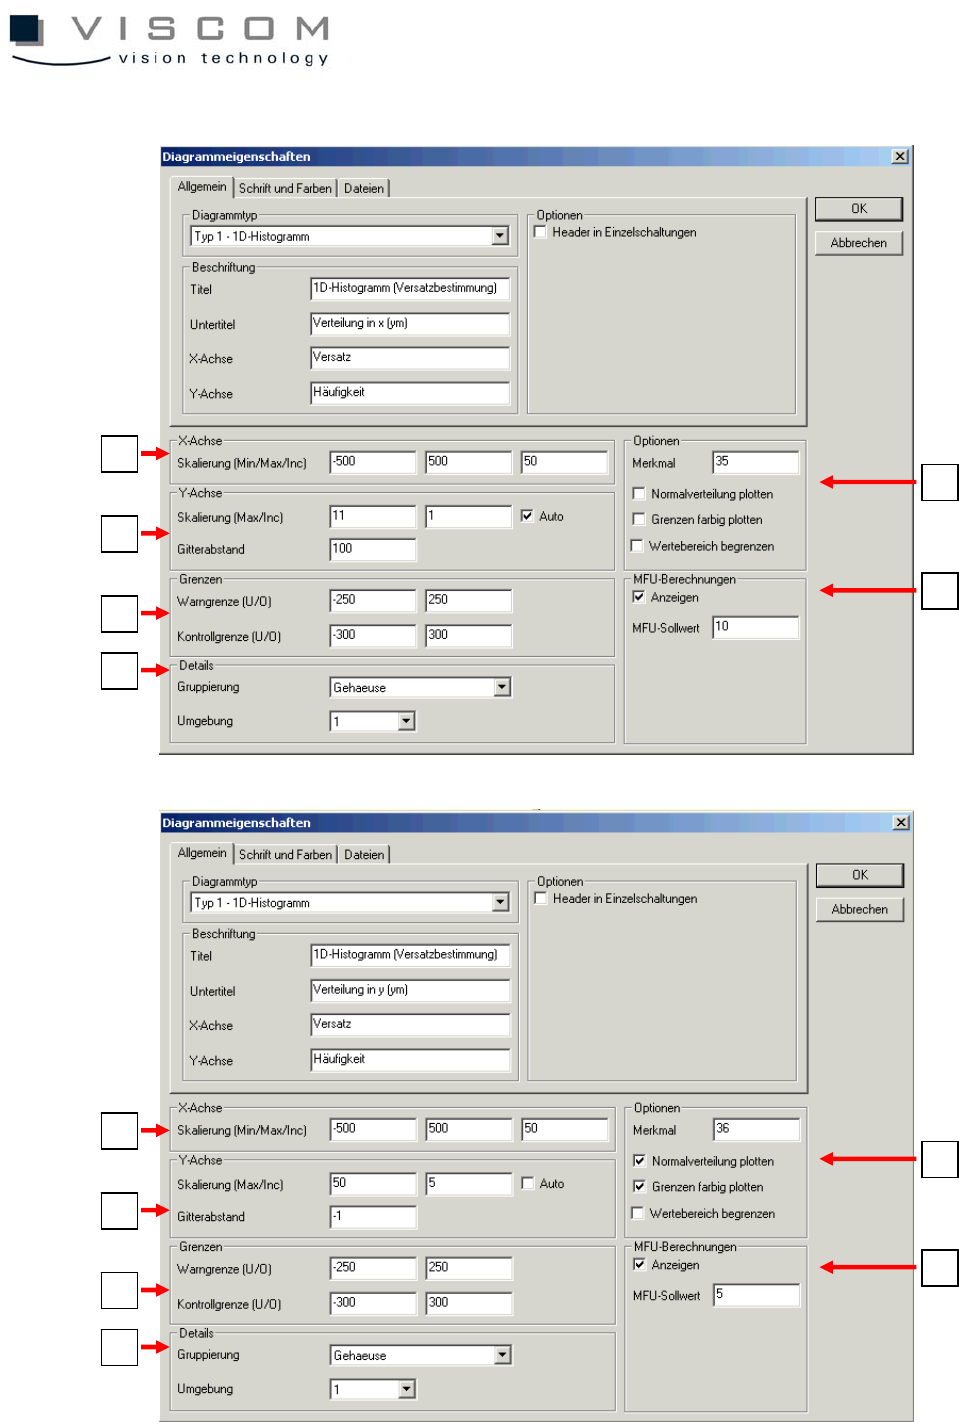
3.2.4 Data evaluation by determining one-dimensional displacement
Diagram type 1 offers another possibility for display. With it, the displacement
value of a component can be displayed as a Gauss curve, for example. This
display is one-dimensional and so must be set once for the X-axis and once for
the Y-axis, separately.
Both diagram properties (X- and Y-axes) are shown as examples.
warning limit minimum
warning limit maximum
control limit minimum
control limit minimum
evaluation curve
maxima
evaluation curve
minima
68/144
1
2
3
4
5
6
1
2
3
4
5
6