1.011.1_VPC使用手册.pdf - 第53页
52/144 1 features group 1 (pseudo defec ts), group 2 (real defects) 2 Options: - no bars with the value 0 - no bars with the value infinite - automatic scaling of the Y-axis - evaluate double track data separately The sm…
51/144
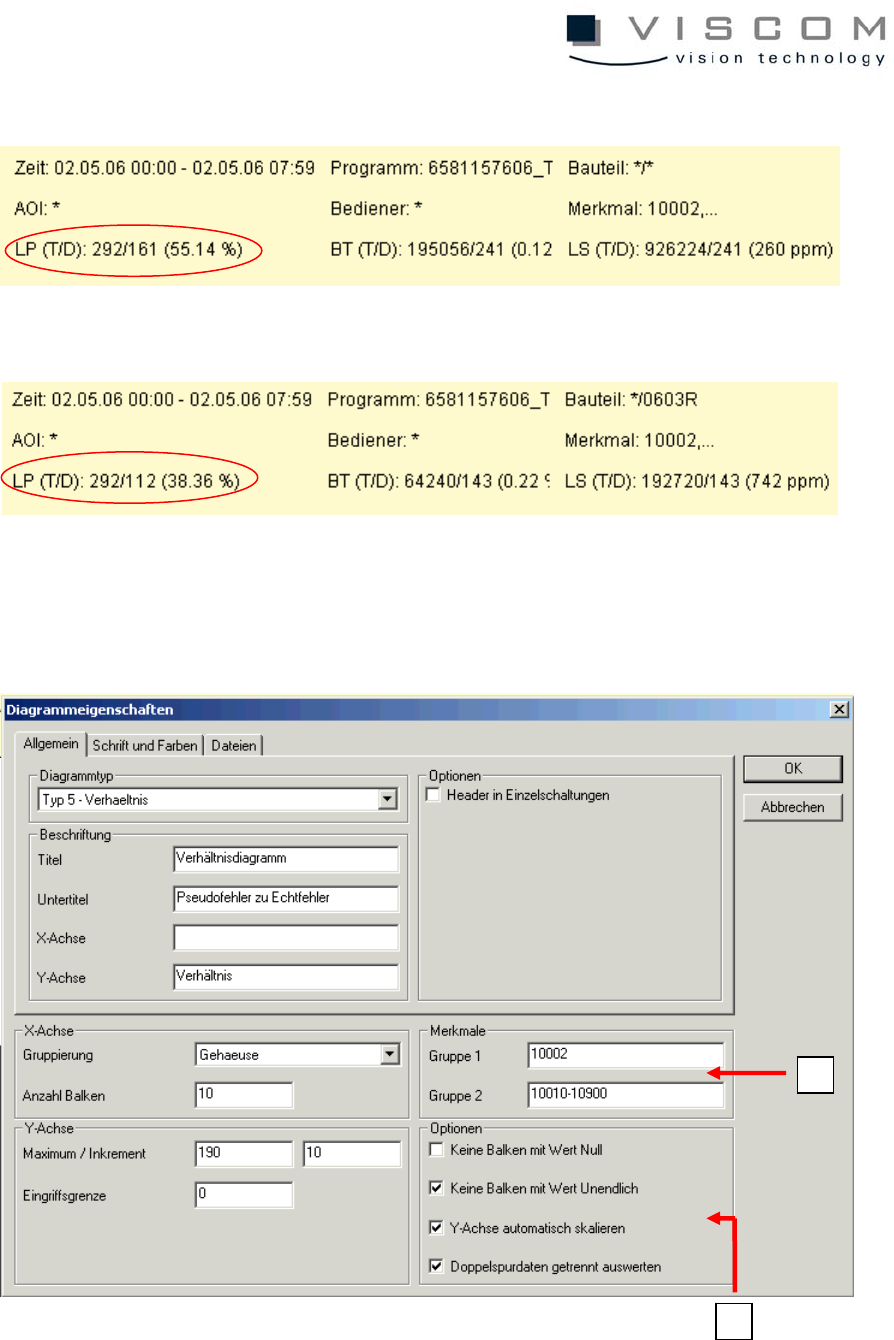
Before:
After:
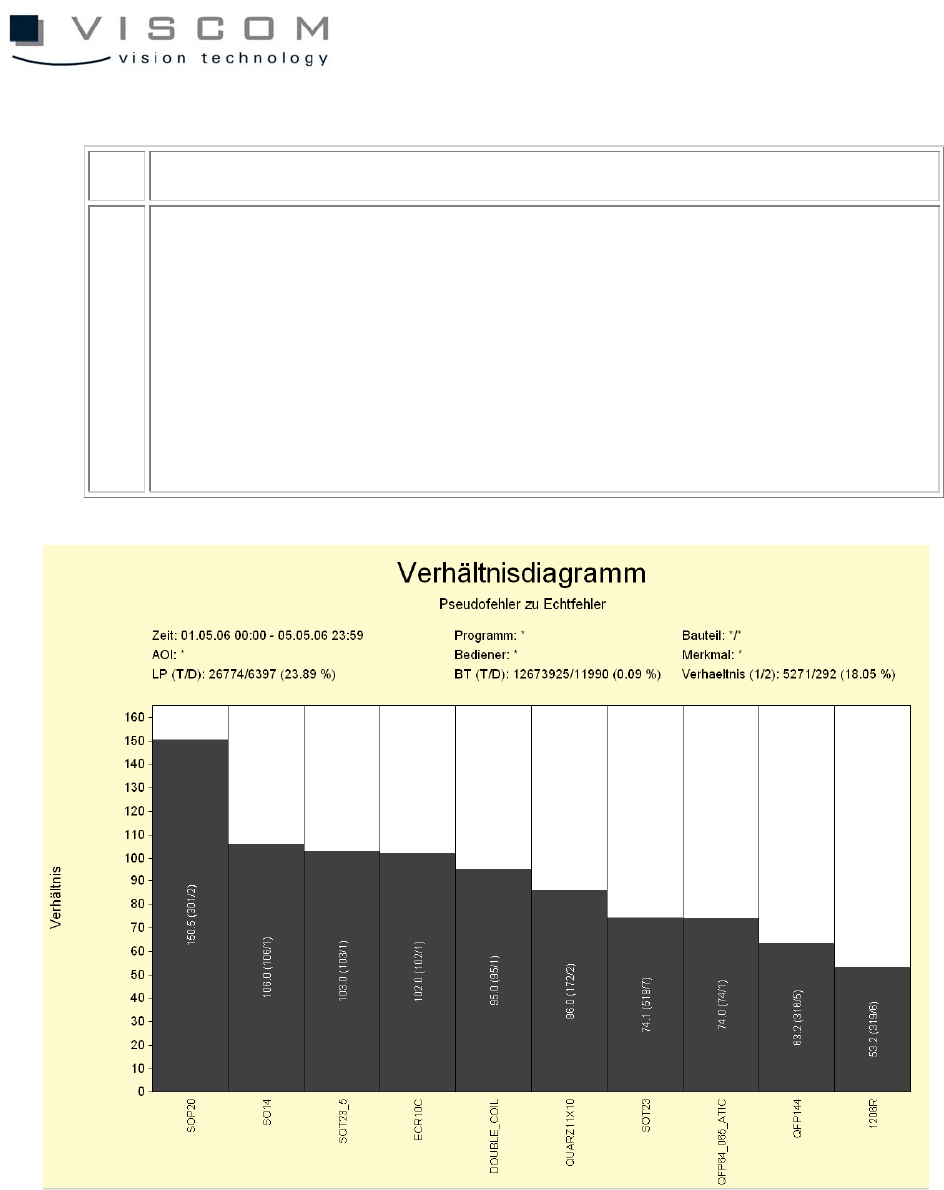
The third and last possibility is the ratio diagram, which gives the ratio of pseudo
defects to real defects.
1
2
52/144
1 features group 1 (pseudo defects), group 2 (real defects)
2 Options:
- no bars with the value 0
- no bars with the value infinite
- automatic scaling of the Y-axis
- evaluate double track data separately
The smaller the first number in the respective bar, the more effective the
inspection pattern. The first number in the brackets is the number of inspection
windows with the features of the first group, divided by the number of inspection
windows with the features of the second group.

53/144
2.1 Exercise 3:
Please select the time axis diagram in the pull-down menu and start the
evaluation. The time filter is preset.
1. There are seven inspection plans in the evaluation time period with a
First Pass Yield of less than 50%. Use the templates to analyze the
two inspection plans with the lowest FPY until you have received the
following information:
top pseudo defect component type
ID
window number
analysis process
How large is the first pass yield, when
the Top1 pseudo defect is eliminated?