1.011.1_VPC使用手册.pdf - 第45页
44/144 Additional information in the Pareto diagram: 1 time filter (the set eval uation period is displayed) 2 program filter (the inspection plan set in the filter is displayed) 3 component filter (not se t, and so mark…

43/144
44/144
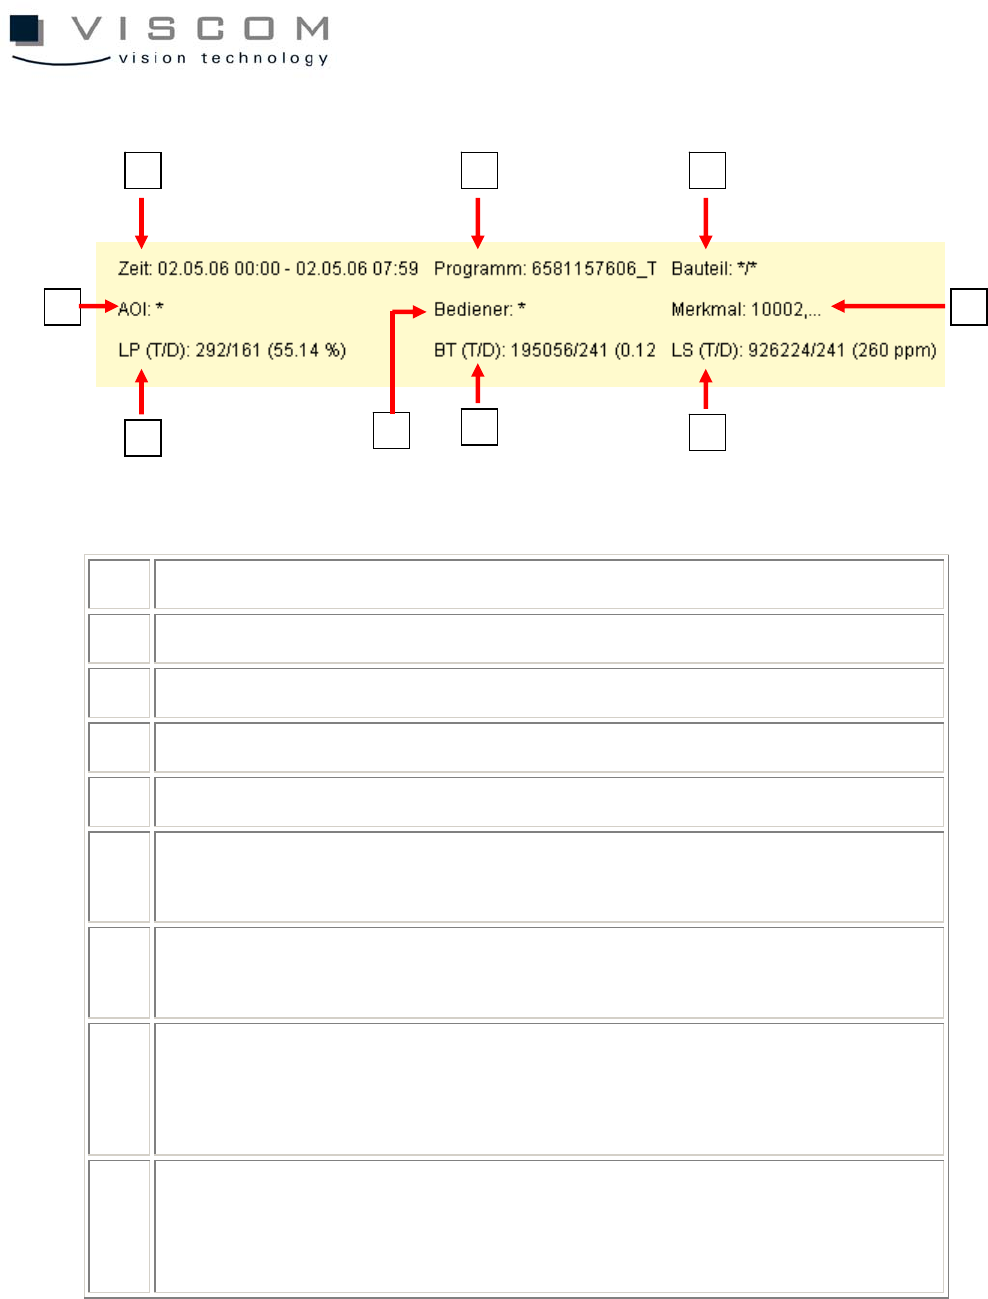
Additional information in the Pareto diagram:
1 time filter (the set evaluation period is displayed)
2 program filter (the inspection plan set in the filter is displayed)
3 component filter (not set, and so marked with */*)
4 machine filter (not set, and so marked with *)
5 operator filter (not set, and so marked with *)
6 features filter (due to lack of space only the first filter entry is displayed;
the fact that others follow is recognized by the ellipses [,...])
7 total number of evaluated PCBs / indication of defective PCBs, result in
% (can also be switched to single panel display, in diagram properties)
8 total number of evaluated components / indication of defective
components, result in %. If a value is 0, the file si_sj.cnt or the CLE
entry #CLE_PINS is not maintained.
9 total number of evaluated solder joints / indication of defective solder
joints, result in PPM. If a value is 0, the file si_sj.cnt or the CLE entry
#CLE_PINS is not maintained.
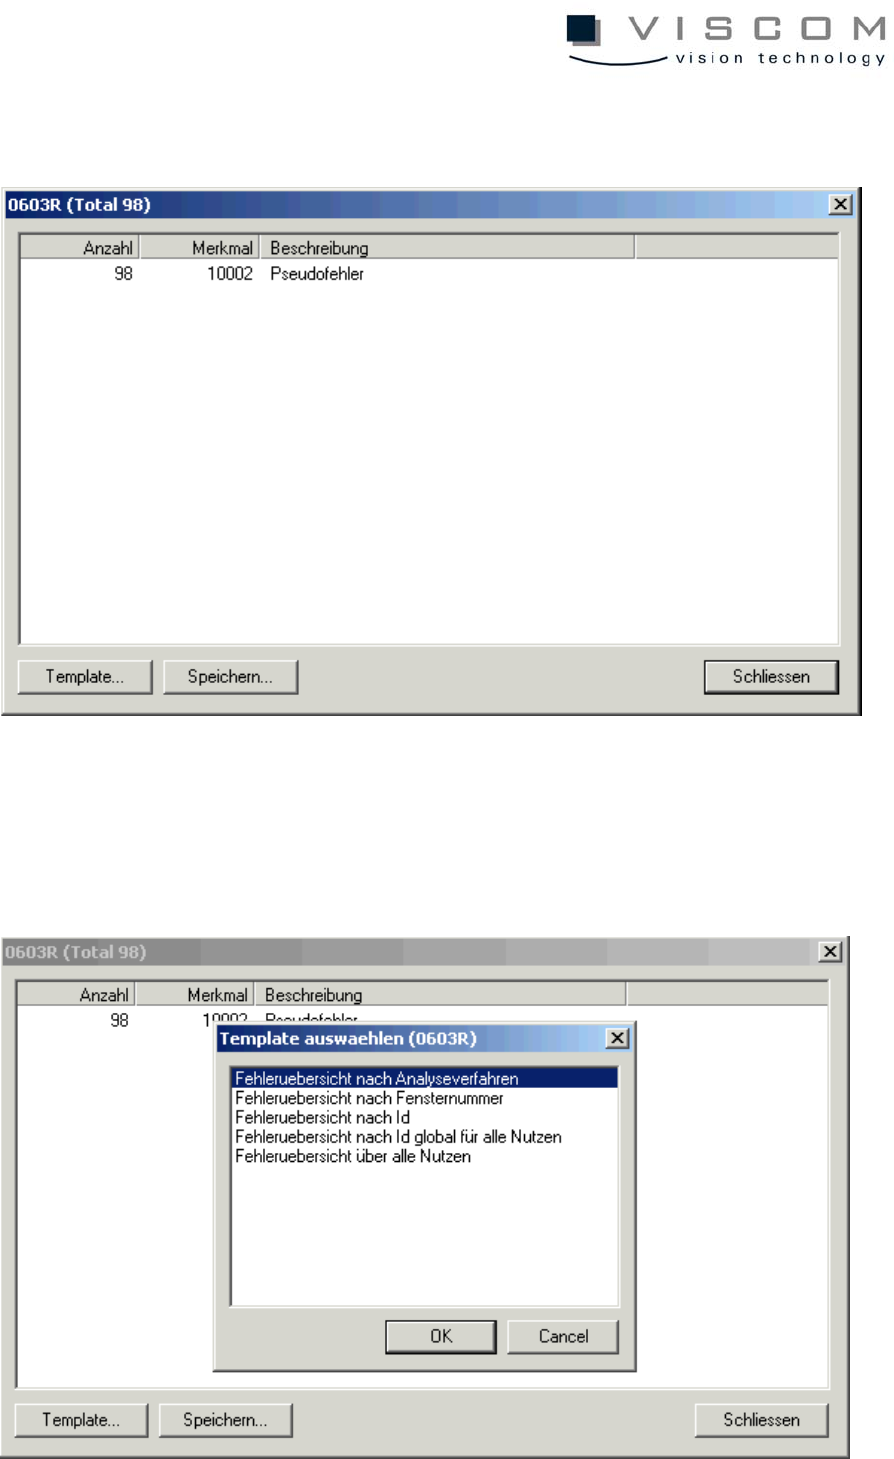
The component type 0603R is responsible for a lot of pseudo defects, but which
analyses is it made up of? In order to get more precise information, the
9
3
8
7
2 1
6 4
5
45/144
procedure can be further evaluated according to analysis procedures, to get the
analysis name. When the left bar is clicked the following mask appears:
The number of defects (98), the feature (10002 = pseudo defect) and the
classification at the repair station (pseudo defect) are listed again. Choosing the
button "Template" brings up the next menu, in which defect overview according
to analysis process is chosen.