1.011.1_VPC使用手册.pdf - 第72页
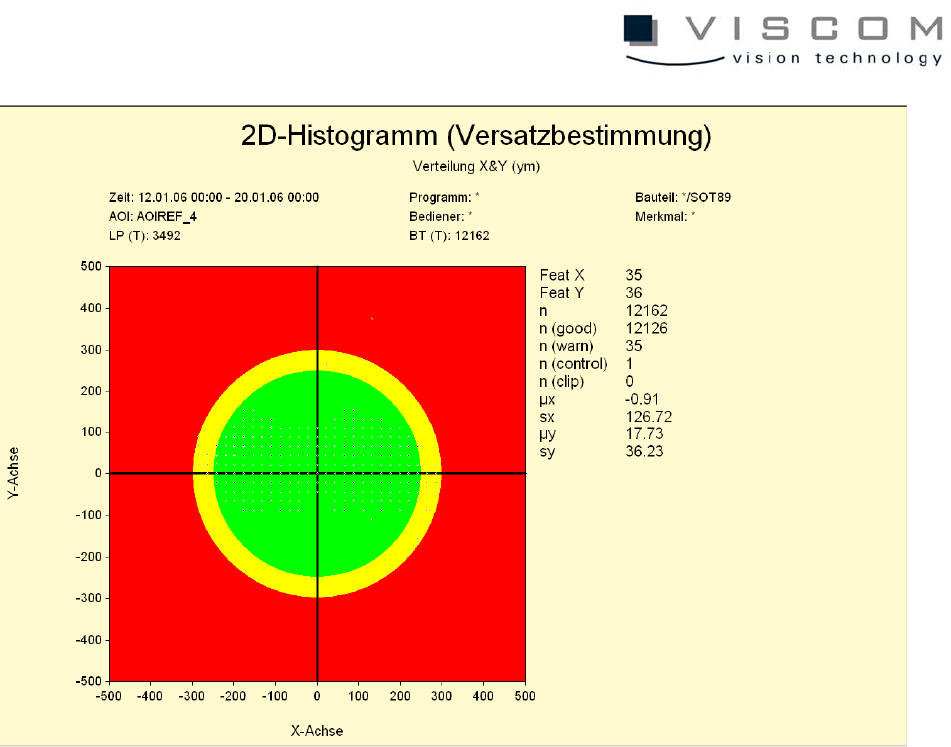
71/144 The data evaluation shows an axis cross hi stogram with colored limits, in which the displacement is indicated by points wit h different sizes. The larger a point is, the more measurement values form t he basis of…
70/144
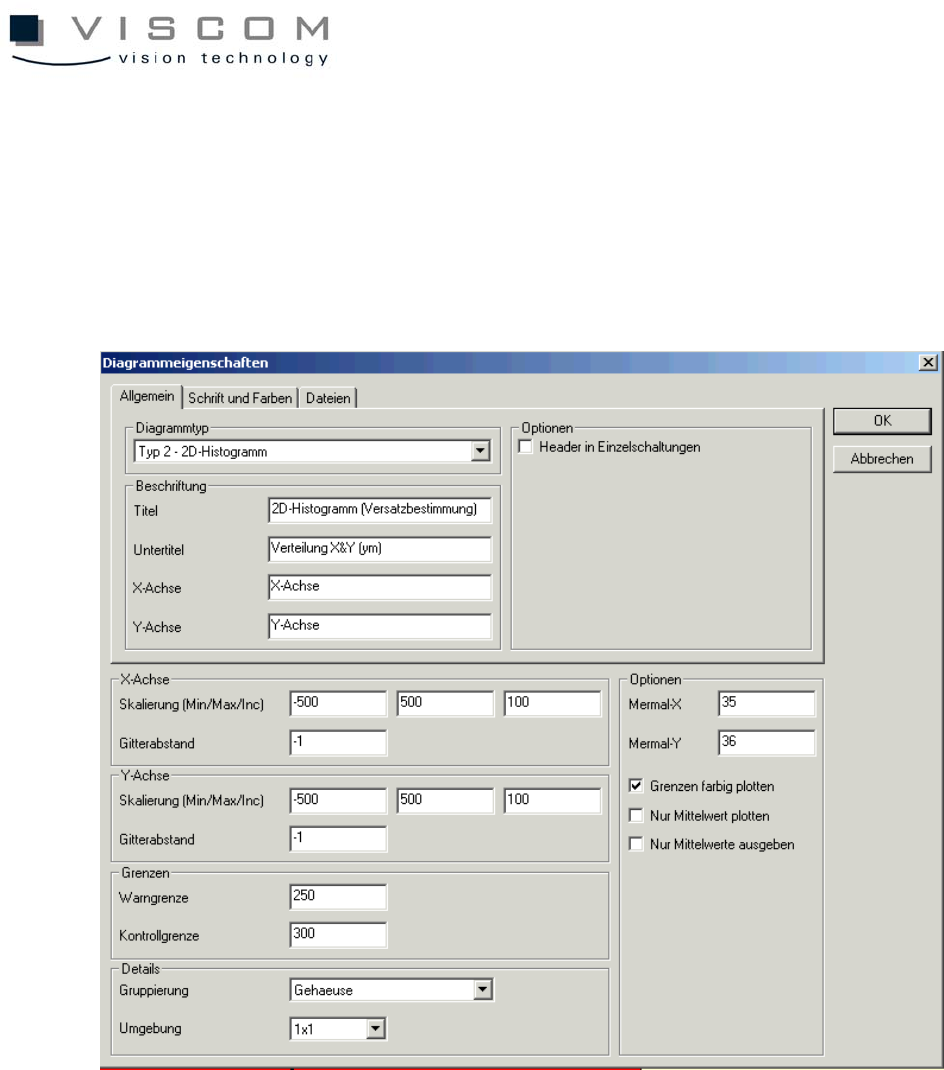
3.2.5 Data evaluation by determining two-dimensional displacement
Diagram type 2 is the third and last possibility. This evaluation functions like the
previous diagram type 1, except the display here is two-dimensional, so
displacement can be shown on two axes at the same time.
71/144
The data evaluation shows an axis cross histogram with colored limits, in which
the displacement is indicated by points with different sizes. The larger a point is,
the more measurement values form the basis of the point. As in the one-
dimensional histogram, additional measurement values that result from the
diagram are also displayed here.
4. Data Flow between the Individual Components and its
Configuration
Before the VPC server is ready to work with, the AOI and the repair station have
to be configured. For this, there are four different modes of data flow between
the components AOI, repair station and VPC server.
72/144
4.1 Standard Configuration
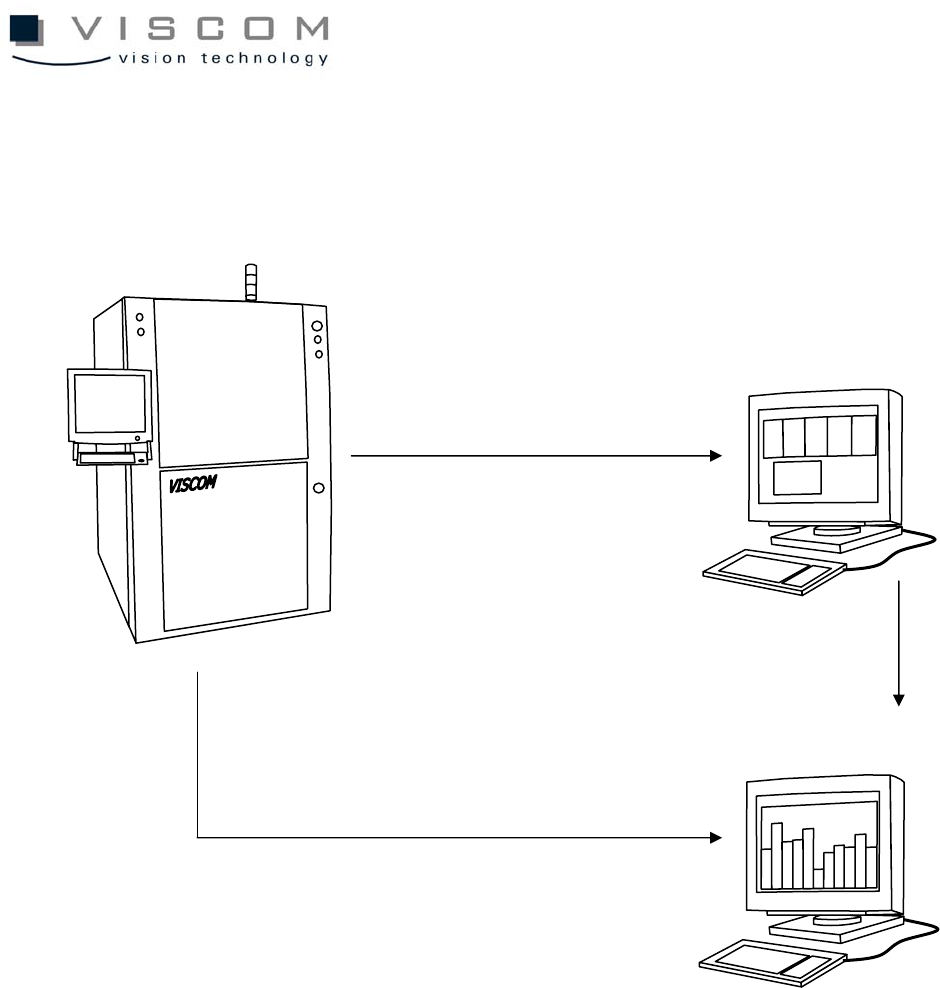
4.1.1 VPC Data Flow (Classical Variant)
Inspection system
VPC Server
VPC files for bad PCBs
Repair station
VPC files for repaired PCBs
VPC files for good PCBs