1.011.1_VPC使用手册.pdf - 第86页
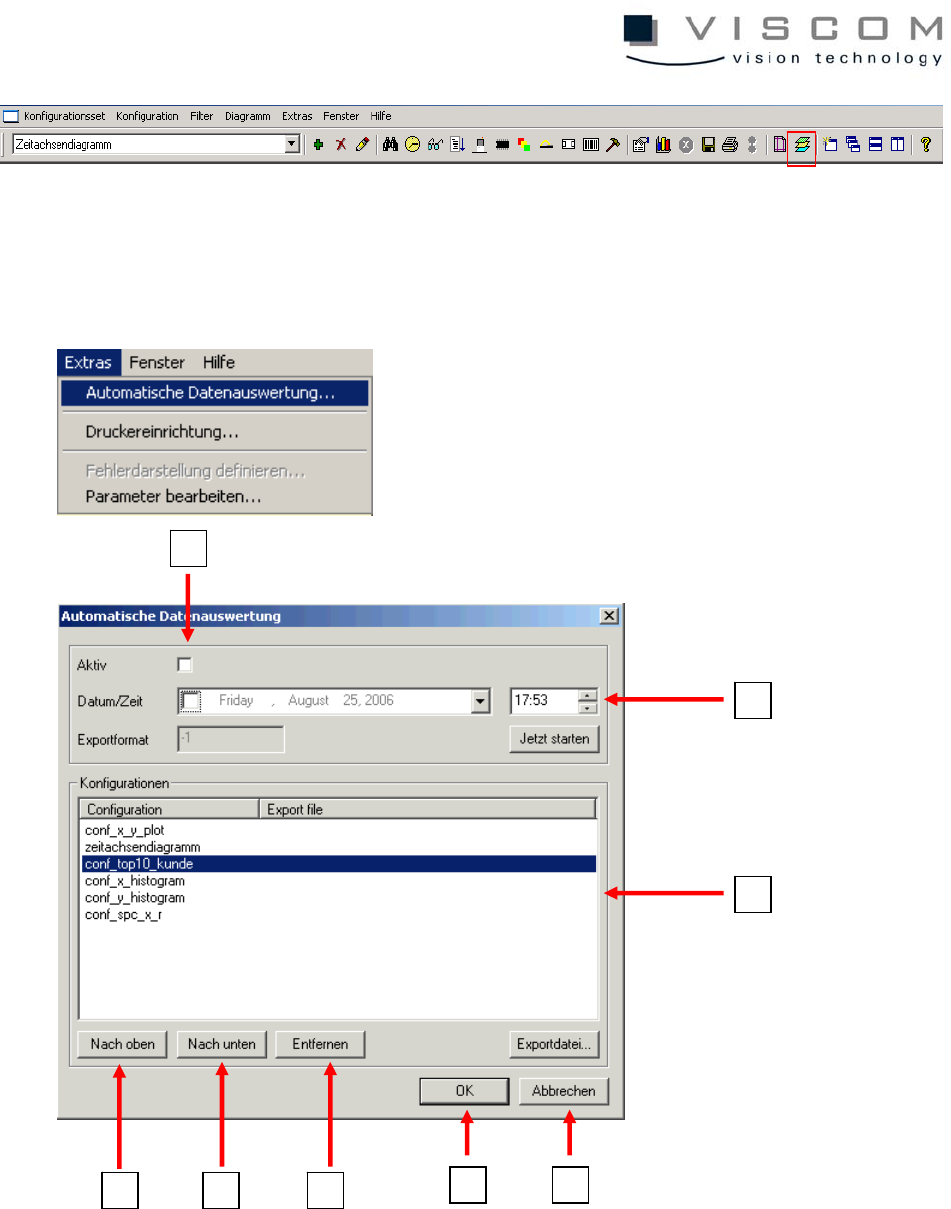
85/144 The menu point "Extras - Automatic data evaluation" displays the configuration dialog illustrated her e, which offers the following options. 1 2 3 4 5 6 8 7
84/144
5. Documentation of Results
5.1 Automatic Data Evaluation
After all the diagram types have been presented and worked with in the
exercises, it becomes clear that every evaluation requires a longer period,
depending on the time filter chosen and the given amount of data.
If the VPC is applied regularly - perhaps daily - in order to document the results,
it can cost a lot of time.
The automatic data evaluation, where as many diagrams as wanted can be
evaluated automatically within a settable time, helps to prevent long waiting
times when a large amount of data is processed. The diagrams created during
this process are filed as Windows bitmaps in a directory structure and can be
further processed in any form.
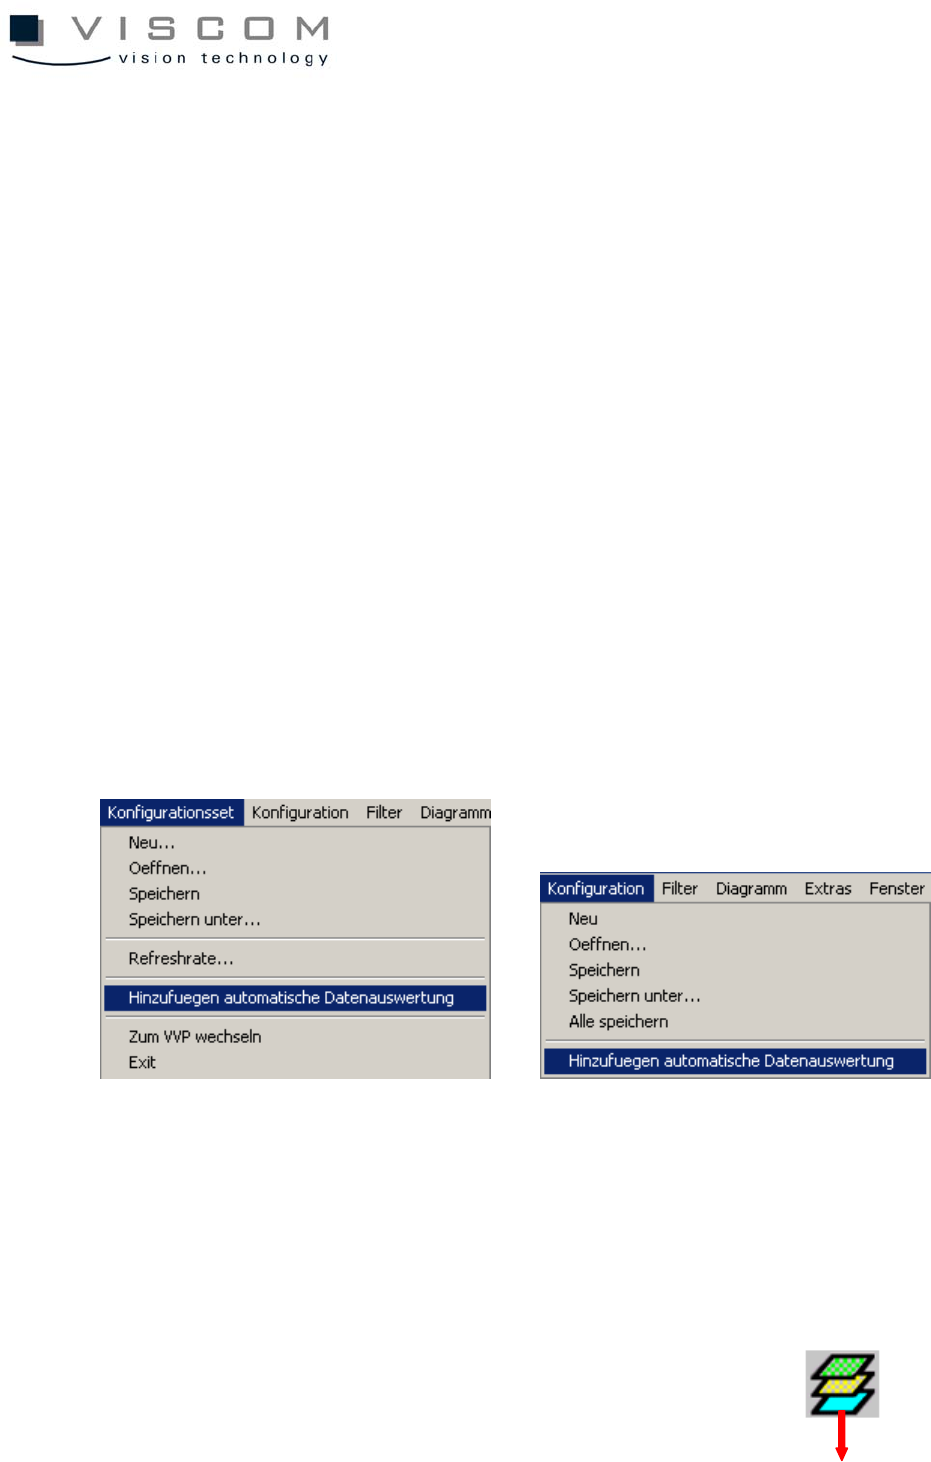
In order to add a loaded diagram (configuration) or the whole configuration set
to the automatic evaluation list, choose the option "Add automatic data
evaluation" in the menu bar.
Doing this automatically adds the active diagram or the active configurations set
to the automatic data evaluation list immediately.
85/144
The menu point "Extras - Automatic data evaluation" displays the configuration
dialog illustrated here, which offers the following options.
1
2
3
4 5 6
8 7

86/144
1 activates time monitoring of the automatic data evaluation; the status of
this option is NOT saved in the configuration file and is always
deactivated after a new start of the VPC software
2 gives the desired evaluation time in the format "date/hour/minute"
3 the list shows all configurations for the automatic data evaluation
currently chosen
4 this button modifies the order of the entries; here: upwards
5 this button modifies the order of the entries; here: downwards
6 entries can be deleted from the list
7 closes the window and deletes all set checkmarks
8 confirms the automatic data evaluation
If the automatic data evaluation is active, the computer time is compared to the
evaluation time once every minute. If the two times agree, a new configuration
set with a diagram is created. All chosen configurations are loaded into this
diagram sequentially and the evaluation is carried out.
A folder in the format YYYYMMDD_HHMM is created in the directory
DATA\BATCH for every automatic evaluation, where the graphics of the
diagrams are stored in the format "diagramname.bmp". The diagram graphics
are saved in this folder in the format "diagramname.bmp".
It could also make sense to save not only the diagram images but also to have
the results as a text file to allow subsequent processing.
5.1.1 Data export with diagram
Here, there are several possibilities for data export.
The simplest possibility is to click with the left mouse button on a chosen
column (for example, the time axis diagram type 4).
The following window is opened: