1.011.1_VPC使用手册.pdf - 第52页
51/144 Before: After: The third and last possibility is the ratio diagram, which gives the ratio of pseudo defects to real defects. 1 2
50/144
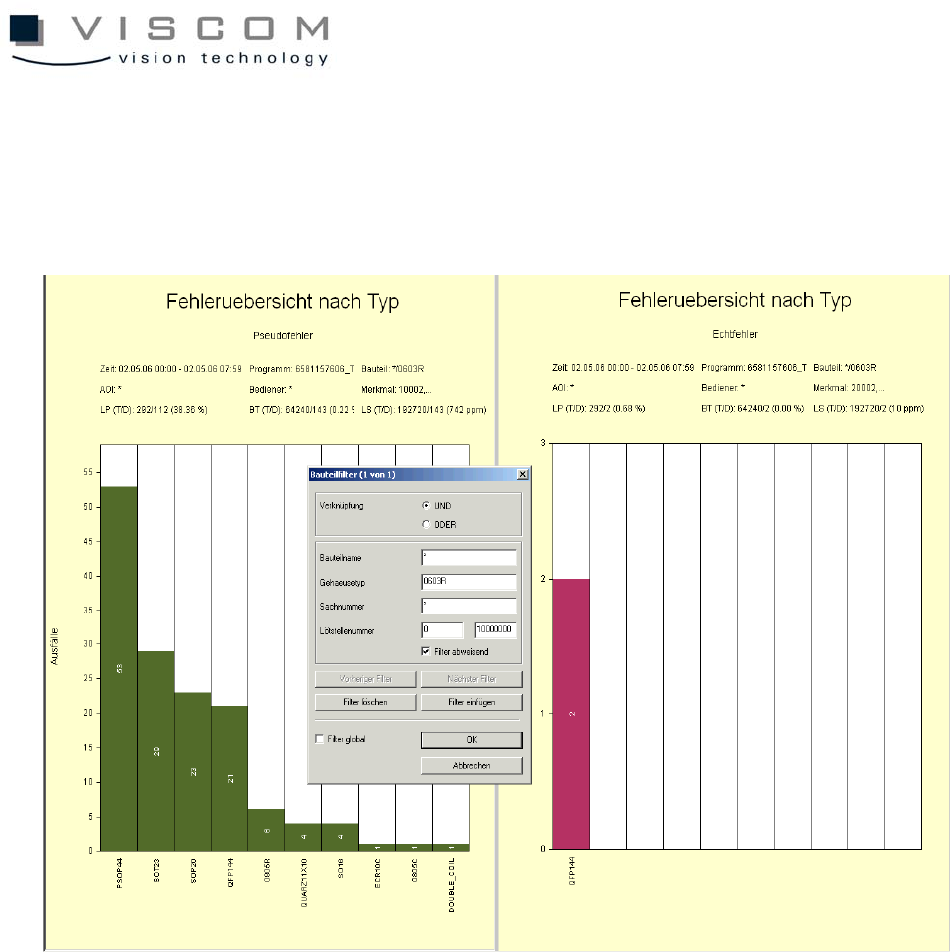
For this, click the left mouse button with a pressed Control button in, for
example, the defect overview for component form in the bar 0603R. If a data
evaluation is started, the first bar disappears. It is automatically taken over as
rejected by the component filter in both the diagrams.
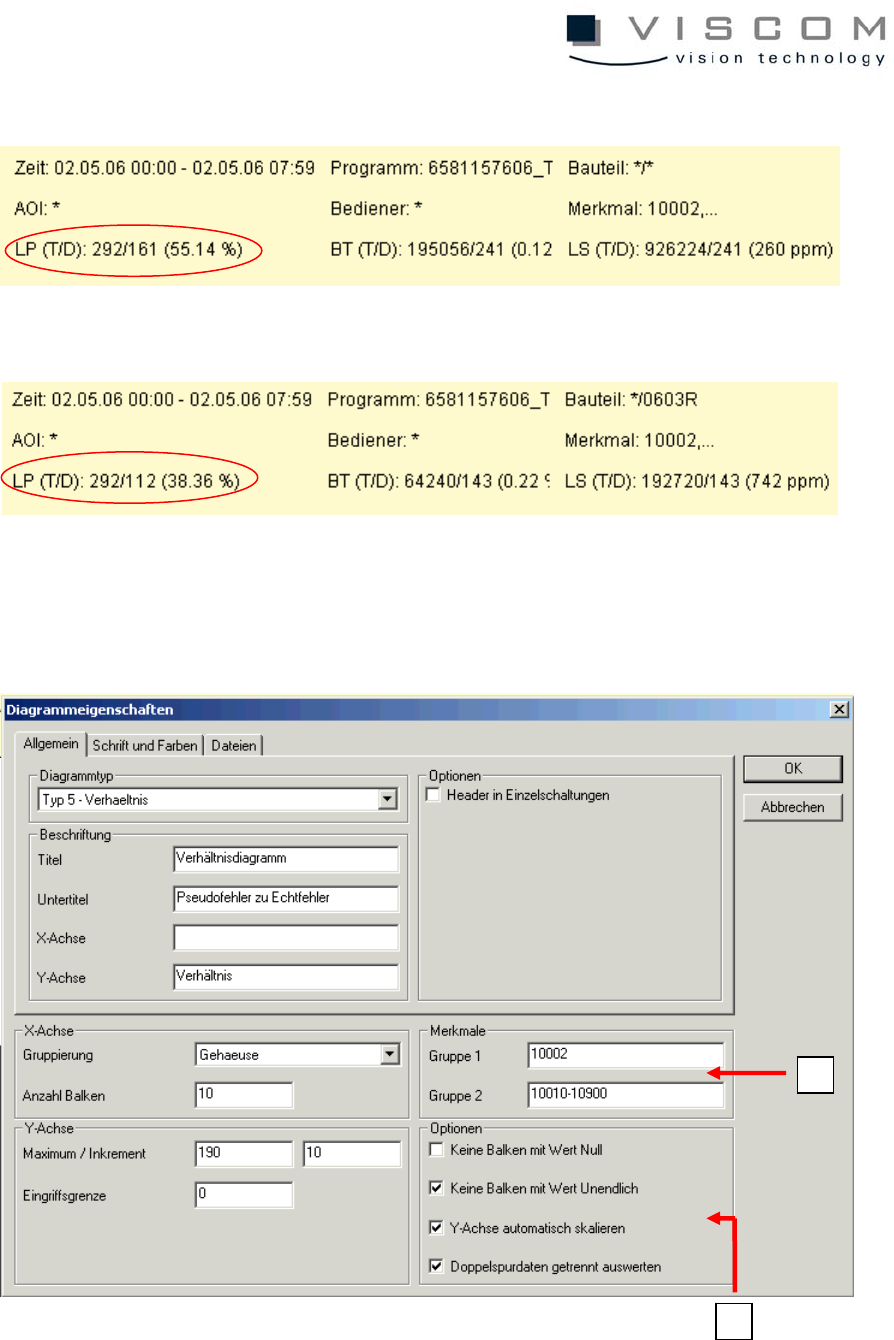
The header shows the reduction of the bad PCBs.
51/144
Before:
After:
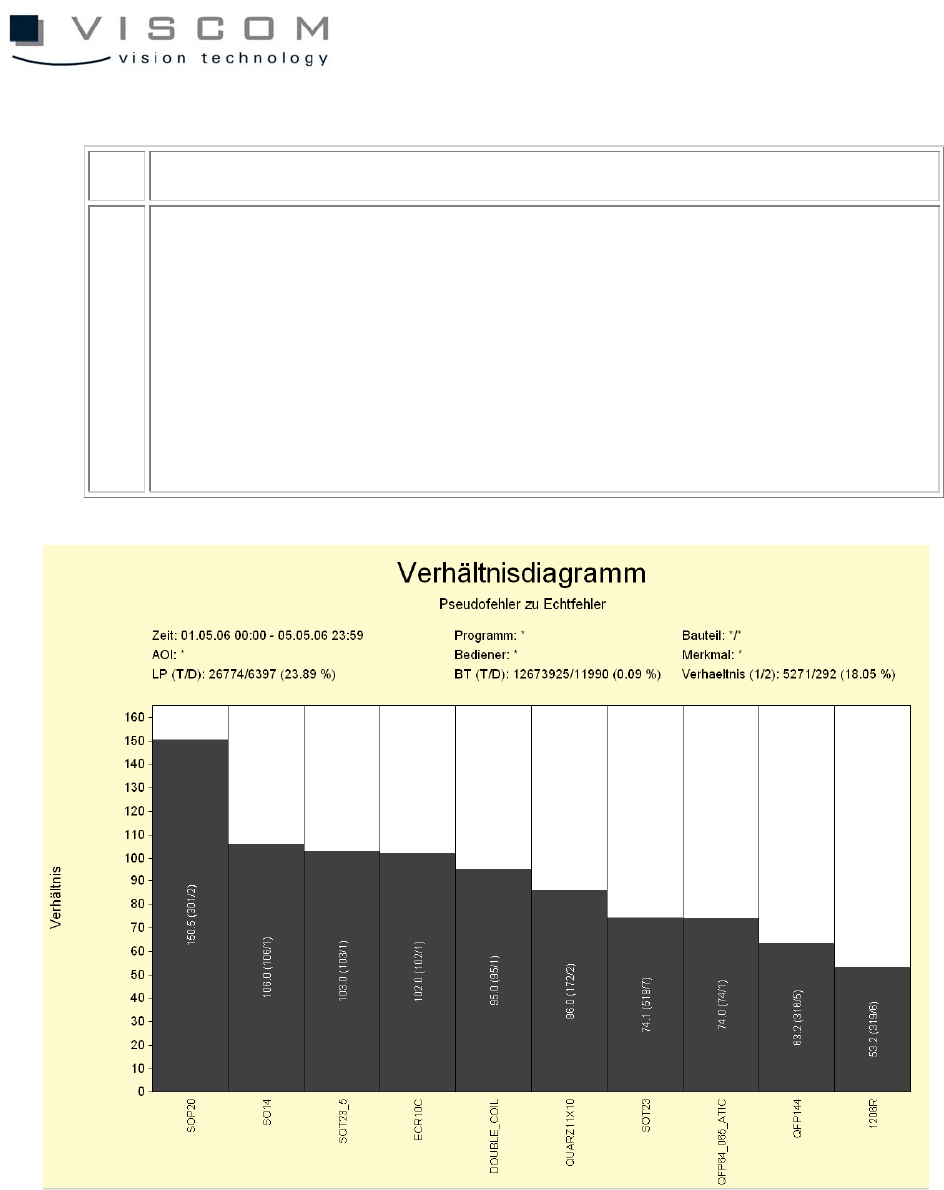
The third and last possibility is the ratio diagram, which gives the ratio of pseudo
defects to real defects.
1
2
52/144
1 features group 1 (pseudo defects), group 2 (real defects)
2 Options:
- no bars with the value 0
- no bars with the value infinite
- automatic scaling of the Y-axis
- evaluate double track data separately
The smaller the first number in the respective bar, the more effective the
inspection pattern. The first number in the brackets is the number of inspection
windows with the features of the first group, divided by the number of inspection
windows with the features of the second group.