1.011.1_VPC使用手册.pdf - 第66页
65/144 1 choice of local and/or global data 2 possible adjustments for the Y-axis 3 evaluation options 4 configuration of additional options 1 2 3 4
64/144
The most important values are shown below:
20 number of points (absolute)
21 number of points (%)
35 x-displacement in (hmm)
36 y-displacement in (hmm)
37 rotation
The following describes the evaluation of the feature values with the diagram
types 0-2.
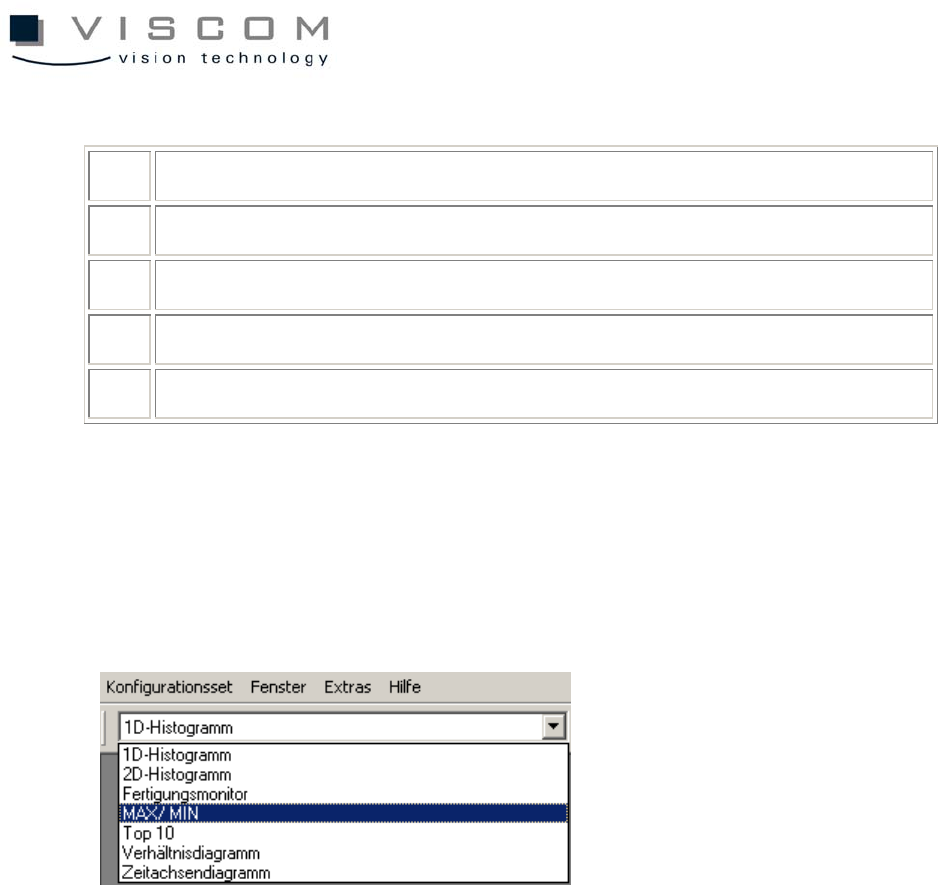
The first diagram type can be reached through the pull-down menu and the
selection "Example: Range".
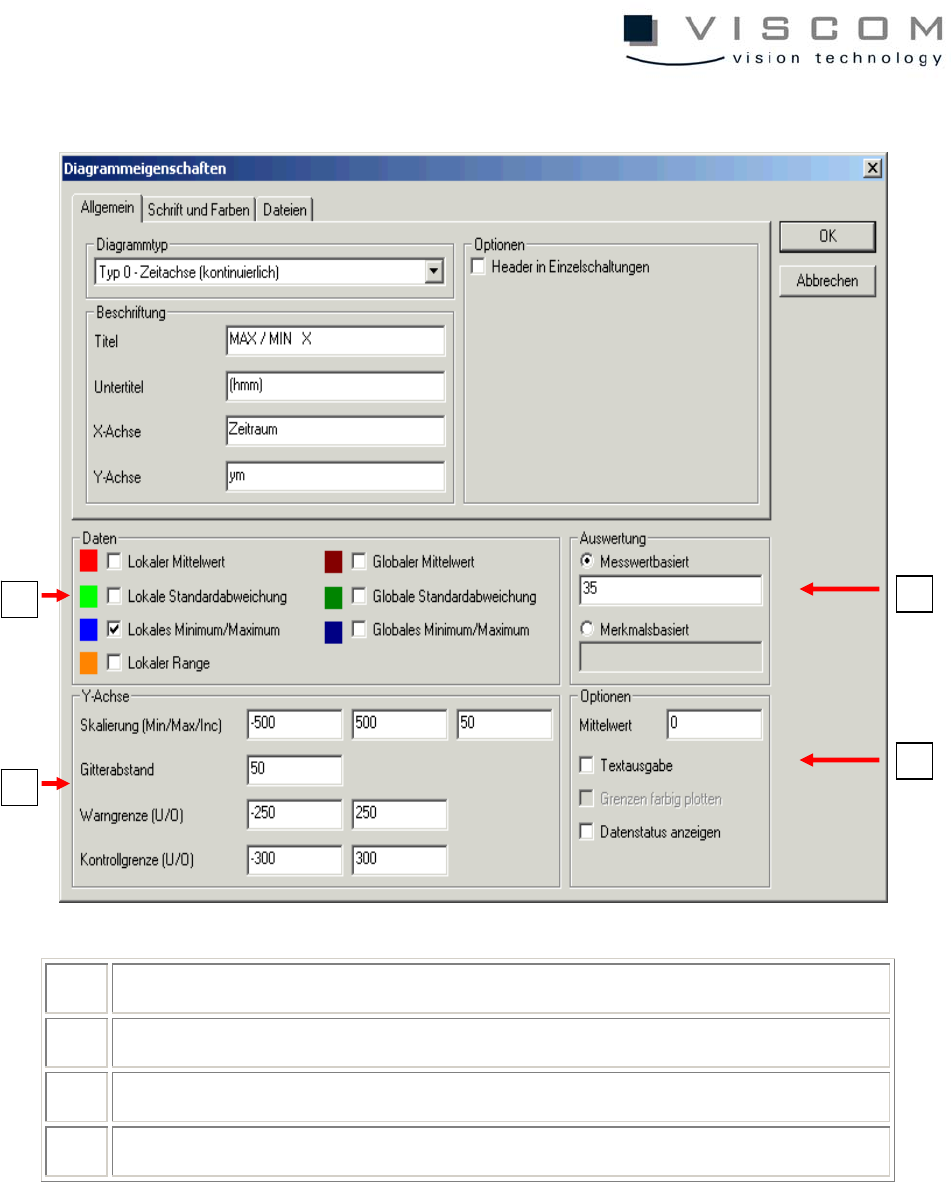
Clicking the menu point "Properties" opens the diagram properties.
65/144
1 choice of local and/or global data
2 possible adjustments for the Y-axis
3 evaluation options
4 configuration of additional options
1
2
3
4
66/144
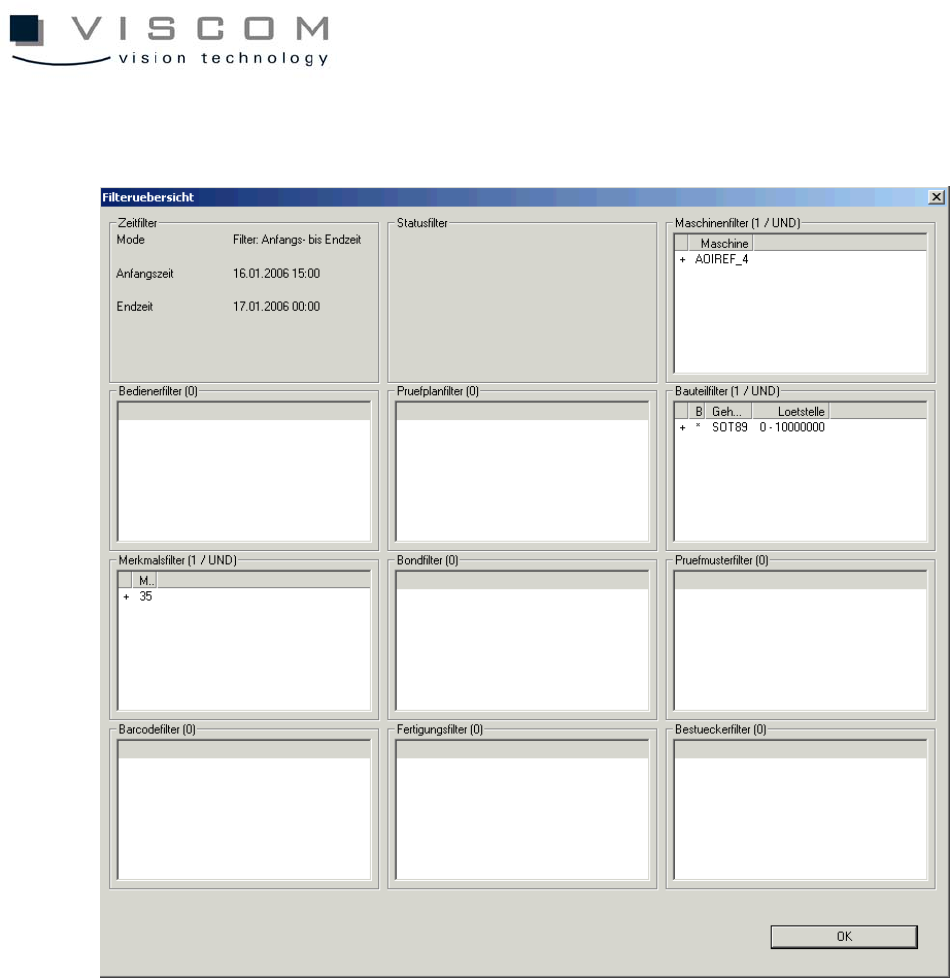
The filter overview shows the following filter settings.
3.2.3 Data evaluation minima/maxima
A click on "Data evaluation" brings up the following image:
There are two blue graphs to indicate the minimum (negative) and maximum
(positive) deviations from the recorded feature values within the evaluation
period.
The warning limit (red line) and the control limit (yellow dotted line) can be seen
for the minimum as well as for the maximum.
The header reads out the number of PCBs, the number of components and the
filters used.