MIL-STD-202H.pdf - 第195页
MI L - S TD - 202 -2 1 3 NOTE: The osc illogram s hou l d i n c l ud e a t i m e ab out 3D long w ith the pulse ap proximately in the center . The integratio n to determi ne t he v e l oc i t y c ha nge s ho ul d e x ten…
MIL-STD-202-213
4.1.2.1.1 Frequency response measurement of the complete instrumentation. The transducer-amplifier-recording
system can be calibrated by subjecting the transducer to sinusoidal vibrations of known frequencies and amplitudes
for the required ranges so that the overall sensitivity curve can be obtained. The sensitivity curve, normalized to be
equal to unity at 100 Hz, should then fall within the limits given on figure 3.
4.1.2.1.2 Frequency response measurement of auxiliary equipment. If calibration factors given for the
accelerometer are such that when used with the associated equipment it will not affect the overall frequency
response, then the frequency response of only the amplifier-recording system may be determined. This shall be
determined in the following manner: Disconnect the accelerometer from the input terminals of its amplifier. Connect
a signal voltage source to these terminals. The impedance of the signal voltage source as seen by the amplifier shall
be made as the impedance of the accelerometer and associated circuitry as seen by the amplifier. With the
frequency of the signal voltage set at 100 Hz, adjust the magnitude of the voltage to be equal to the product of the
accelerometer sensitivity and the acceleration magnitude expected during test conditions. Adjust the system gain to
a convenient value. Maintain a constant input voltage and sweep the input frequency over the range from 1.0 to
9,000 Hz, or 4 to 25,000 Hz, as applicable, depending on duration of pulse. The frequency response in terms of dB
shall be within the limits given on figure 3.
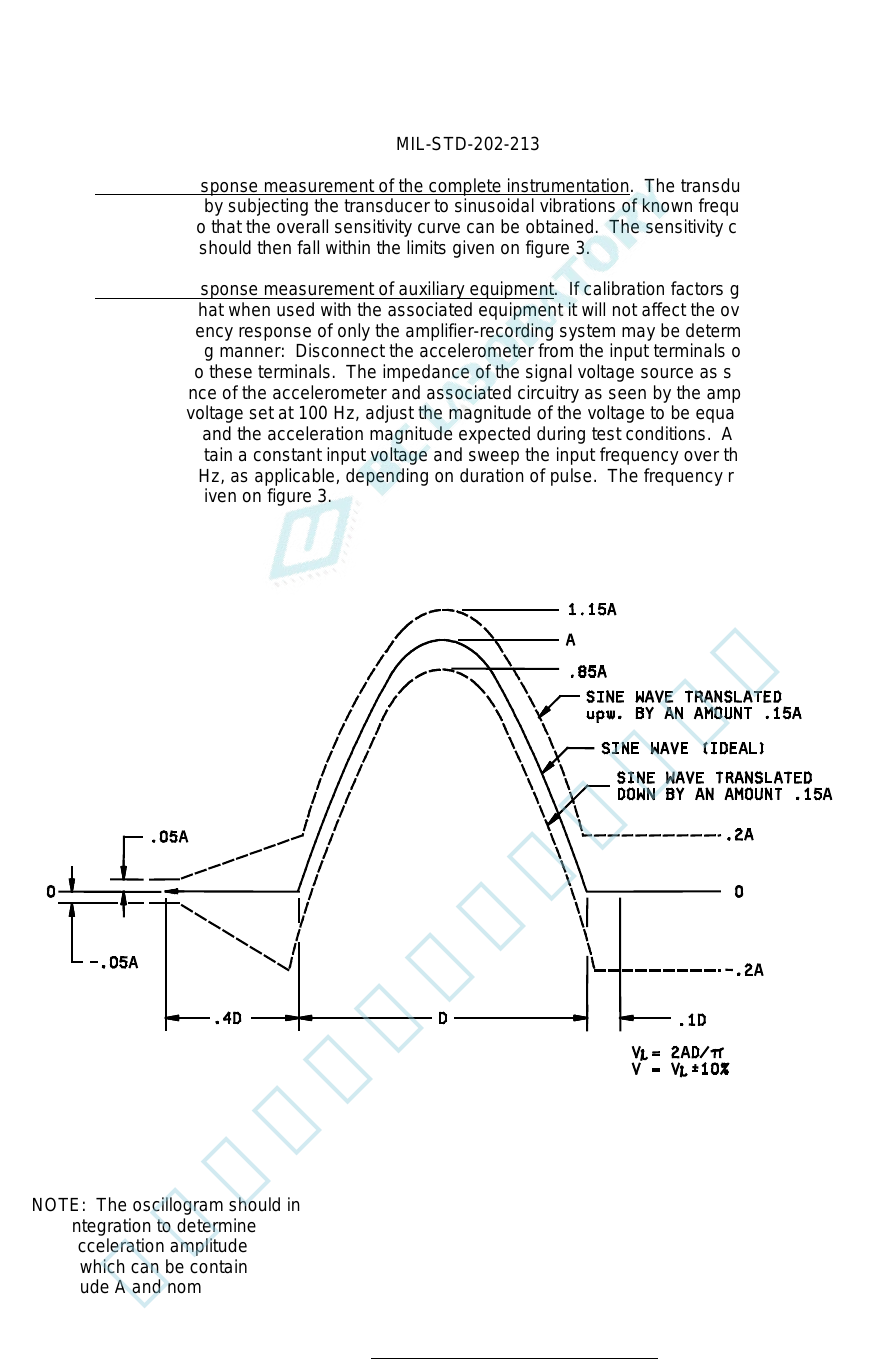
NOTE: The oscillogram should include a time about 3D long with the pulse located approximately in the center.
The integration to determine velocity change should extend from .4D before the pulse to .1D beyond the pulse.
The acceleration amplitude of the ideal half sine pulse is A and its duration is D. Any measured acceleration
pulse which can be contained between the broken line boundaries is a nominal half sine pulse of nominal
amplitude A and nominal duration D. The velocity change associated with the measured acceleration pulse is V.
FIGURE 1. Tolerances for half sine shock pulse.
2
北测(上海)电子科技有限公司
联系方式:xuyj@beice-sh.com 13917165676
MIL-STD-202-213
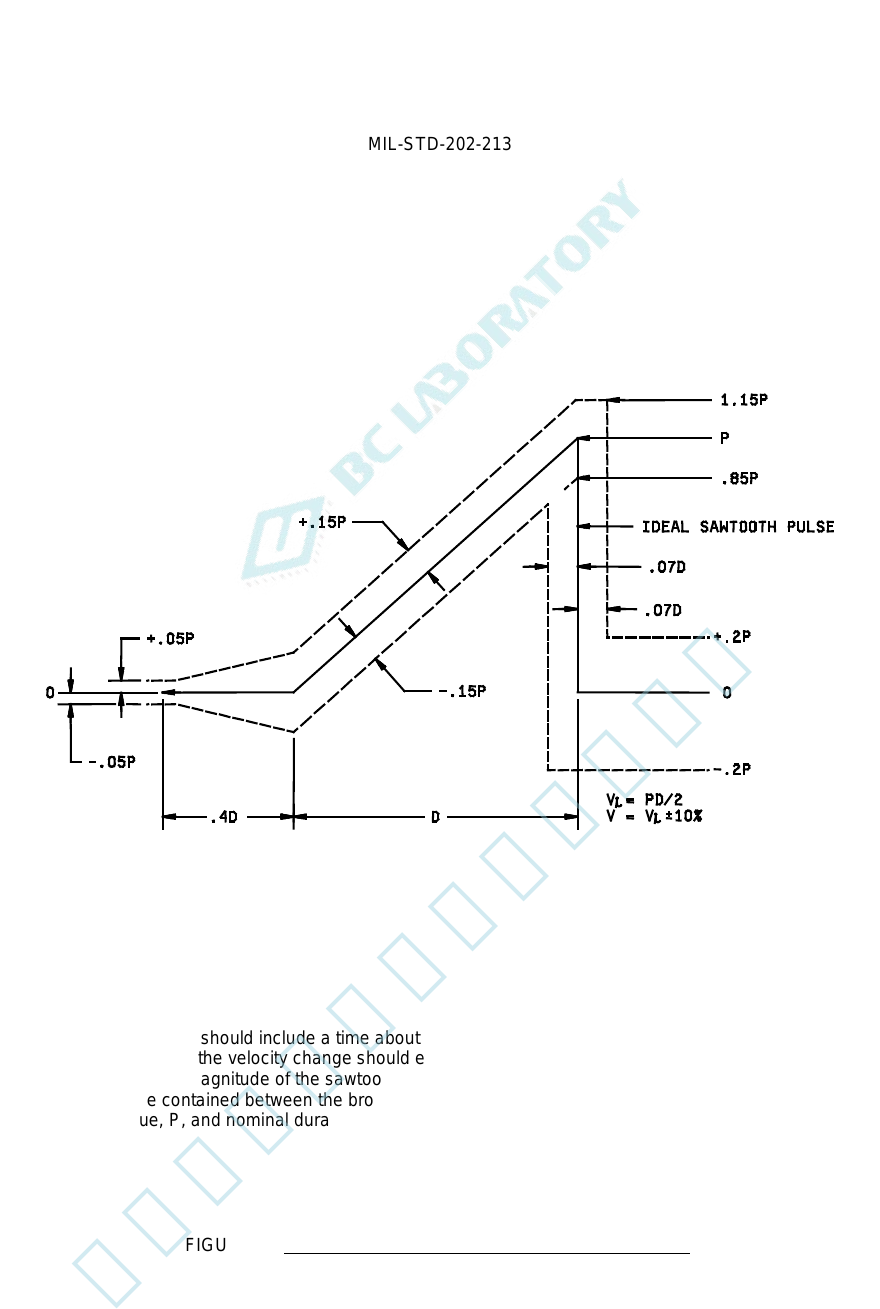
NOTE: The oscillogram should include a time about 3D long with the pulse approximately in the center. The
integration to determine the velocity change should extend from .4D before the pulse to .1D beyond the pulse.
The peak acceleration magnitude of the sawtooth pulse is P and its duration is D. Any measured acceleration
pulse which can be contained between the broken line boundaries is a nominal terminal-peak sawtooth pulse of
nominal peak value, P, and nominal duration, D. The velocity change associated with the measured acceleration
pulse is V.
FIGURE 2. Tolerances for terminal-peak sawtooth shock pulse.
3
北测(上海)电子科技有限公司
联系方式:xuyj@beice-sh.com 13917165676
MIL-STD-202-213
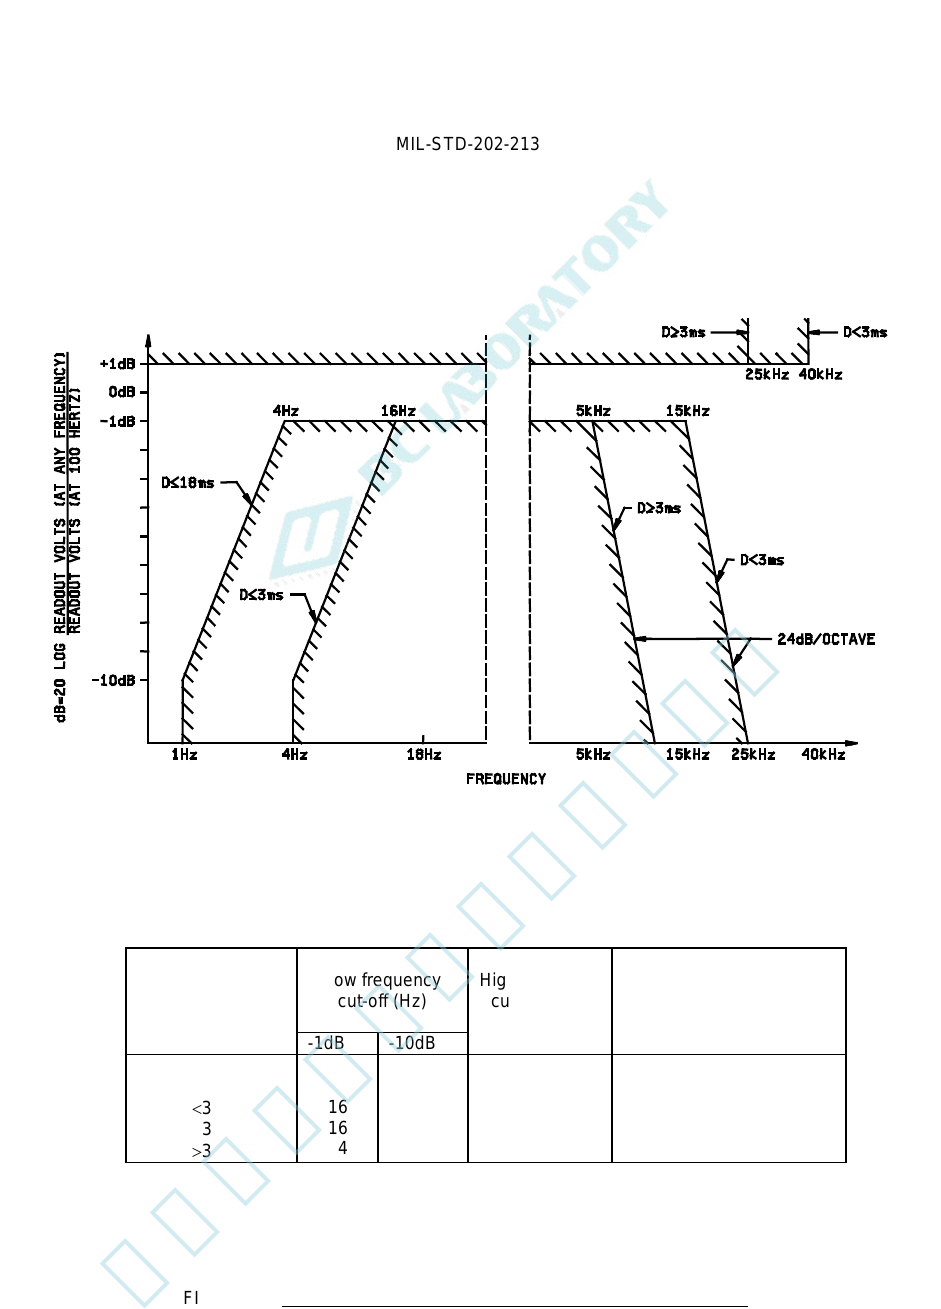
Duration of pulse
(ms)
Low frequency
cut-off (Hz)
High frequency
cut-off (kHz)
-1 dB
Frequency beyond which
the response may rise
above +1 dB (kHz)
-1dB -10dB
3
<3
3
>3
16
16
4
4
4
1
15
5
5
40
25
25
FIGURE 3. Tolerance limits for measuring system frequency response.
4
北测(上海)电子科技有限公司
联系方式:xuyj@beice-sh.com 13917165676