MIL-STD-202H.pdf - 第205页
MI L - S TD - 202 -2 1 4 4.3 Procedure . The s pe c i m e n, or s ub s t i t ut e e qui v a l ent m a s s , s hal l be m o unt e d i n ac c or d a nce with 3 and the monitori ng equipment at t ac he d, i f appl i c abl e…
MIL-STD-202-214
4.1.1.1 Control and analysis of vibration.
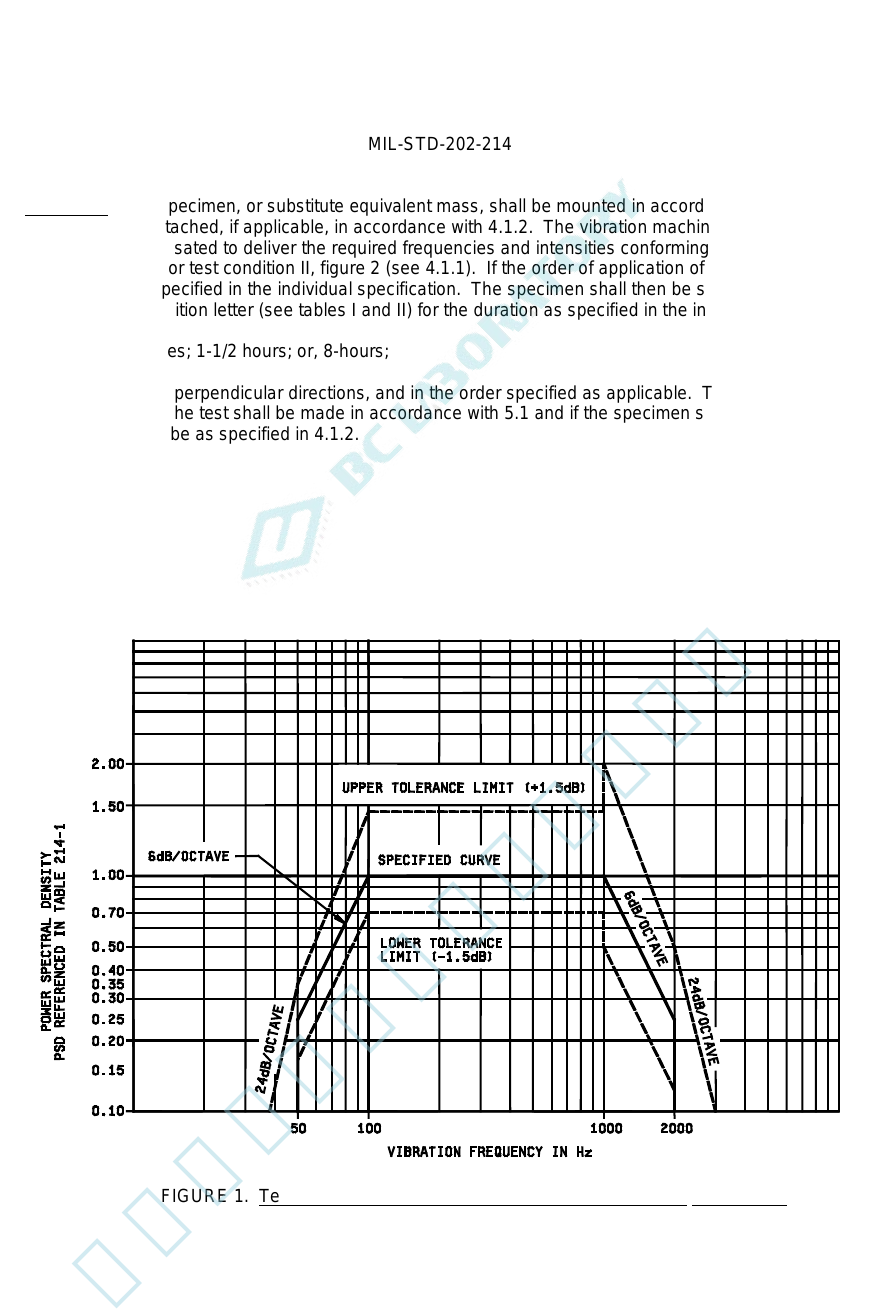
a. Spectral density curves. The output of the vibration machine shall be presented graphically as power
spectral density versus frequency. 1/ The spectral density values shall be within +40 and -30 percent (±1.5
dB) of the specified values between a lower specified frequency and 1,000 Hz, and within +100 and -50
percent (±3 dB) of the specified values between 1,000 and 2,000 Hz. A filter bandwidth will be a maximum
of 1/3 octave or a frequency of 25 Hz, whichever is greater.
b. Distribution curves. A probability density distribution curve may be obtained and compared with a gaussian
distribution curve. The experimentally obtained curve should not differ from the gaussian curve by more
than ±10 percent of the maximum value.
4.1.2 Monitoring. Monitoring involves measurements of the vibration excitation and of the test item performance.
When required in the individual specification, the specimen may be monitored during the test. The details of the
monitoring circuit, including the method and points of connection to the specimen, shall be specified.
4.1.2.1 Vibration input. The vibration magnitude shall be monitored on a vibration machine, on mounting fixtures,
at locations that are as near as practical to the test item mounting points. When the vibration input is measured at
more than one point, the minimum input vibration shall normally be made to correspond to the specified test curve
(see figures 1 and 2). For massive test items and fixtures, and for large force exciters or multiple vibration exciters,
the input-control value may be an average of the average magnitudes of three or more inputs. Accelerations in the
transverse direction, measured at the test item attachment points, shall be limited to 100 percent of the applied
vibration. The individual specification shall specify the number and location of the test points.
4.2 Method of mounting. The specimens shall be mounted in accordance with the instructions in the individual
specifications. The orientation of the specimen or direction(s) of the applied vibration motion shall be as specified.
Any special test fixtures or jigs required to run the test shall be as specified in sufficient detail in the individual
specification to assure reproducibility of the input motion applied to the specimen. These details shall include the
dimensions, the materials, temper, etc., as applicable.
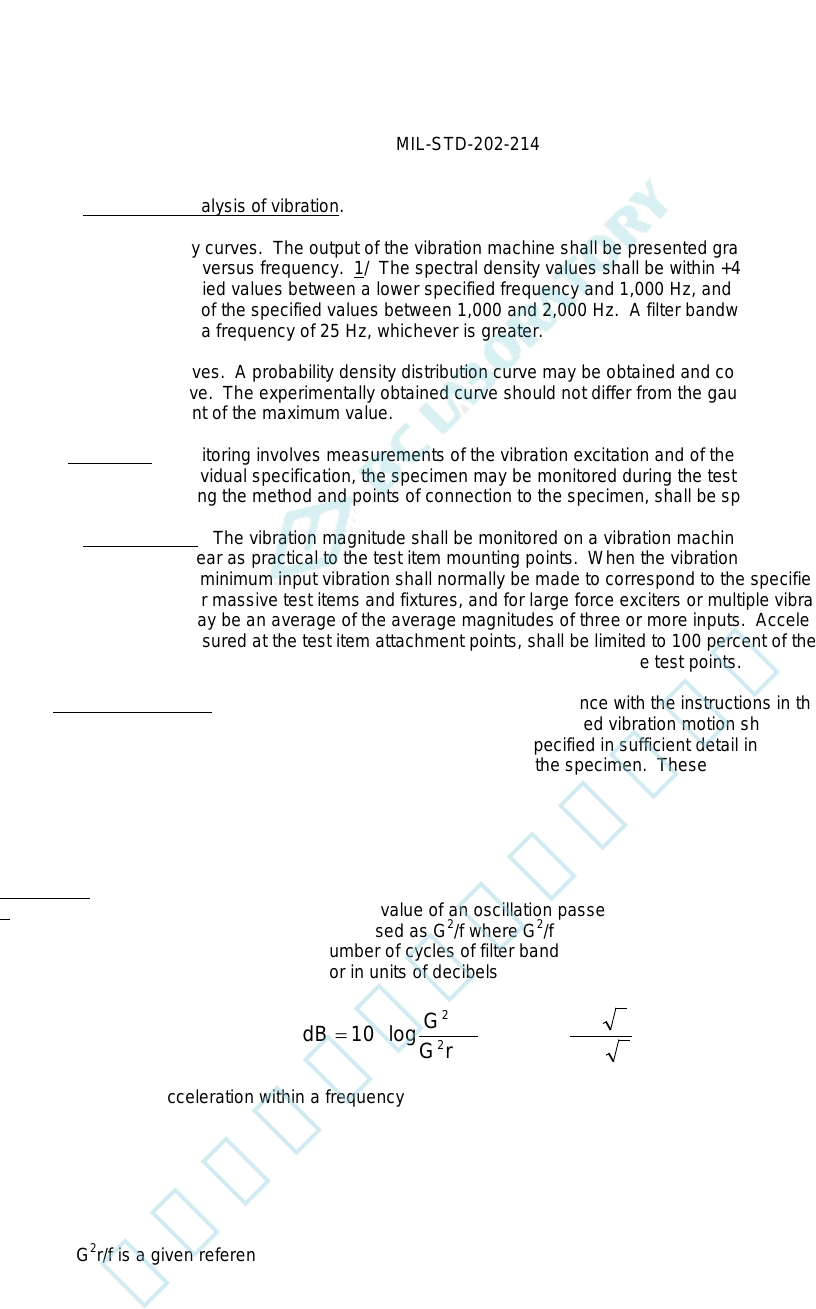
1/ Power spectral density is the mean square value of an oscillation passed by a narrow-band filter per unit filter
bandwidth. For this application it is expressed as G
2
/f where G
2
/f is the mean square value of acceleration
expressed in gravitational units per number of cycles of filter bandwidth. The spectral density curves are usually
plotted either on a logarithmic scale, or in units of decibels (dB). The number of decibels is defined by the
equation:
fG
fG
frG
fG
dB
r
/
/
log20
/
/
log
10
2
2
==
The rms value of acceleration within a frequency band between f
1
and f
2
is:
1/2
2
2
1
=
∫
dff
G
Grms
f
f
Where G
2
r/f is a given reference value of power spectral density, usually the maximum specified value.
2
北测(上海)电子科技有限公司
联系方式:xuyj@beice-sh.com 13917165676
MIL-STD-202-214
4.3 Procedure. The specimen, or substitute equivalent mass, shall be mounted in accordance with 3 and the
monitoring equipment attached, if applicable, in accordance with 4.1.2. The vibration machine shall then be operated
and equalized or compensated to deliver the required frequencies and intensities conforming to the curves specified
test condition I, figure 1, or test condition II, figure 2 (see 4.1.1). If the order of application of the different directions is
critical, it also shall be specified in the individual specification. The specimen shall then be subjected to the vibration
specified by the test condition letter (see tables I and II) for the duration as specified in the individual specification:
3-minutes; 15-minutes; 1-1/2 hours; or, 8-hours;
In each of three mutually perpendicular directions, and in the order specified as applicable. The measurements made
before, during, and after the test shall be made in accordance with 5.1 and if the specimen shall be monitored during
the test, the details shall be as specified in 4.1.2.
FIGURE 1. Test condition I, random vibration test-curve envelope (see table I).
3
北测(上海)电子科技有限公司
联系方式:xuyj@beice-sh.com 13917165676
MIL-STD-202-214
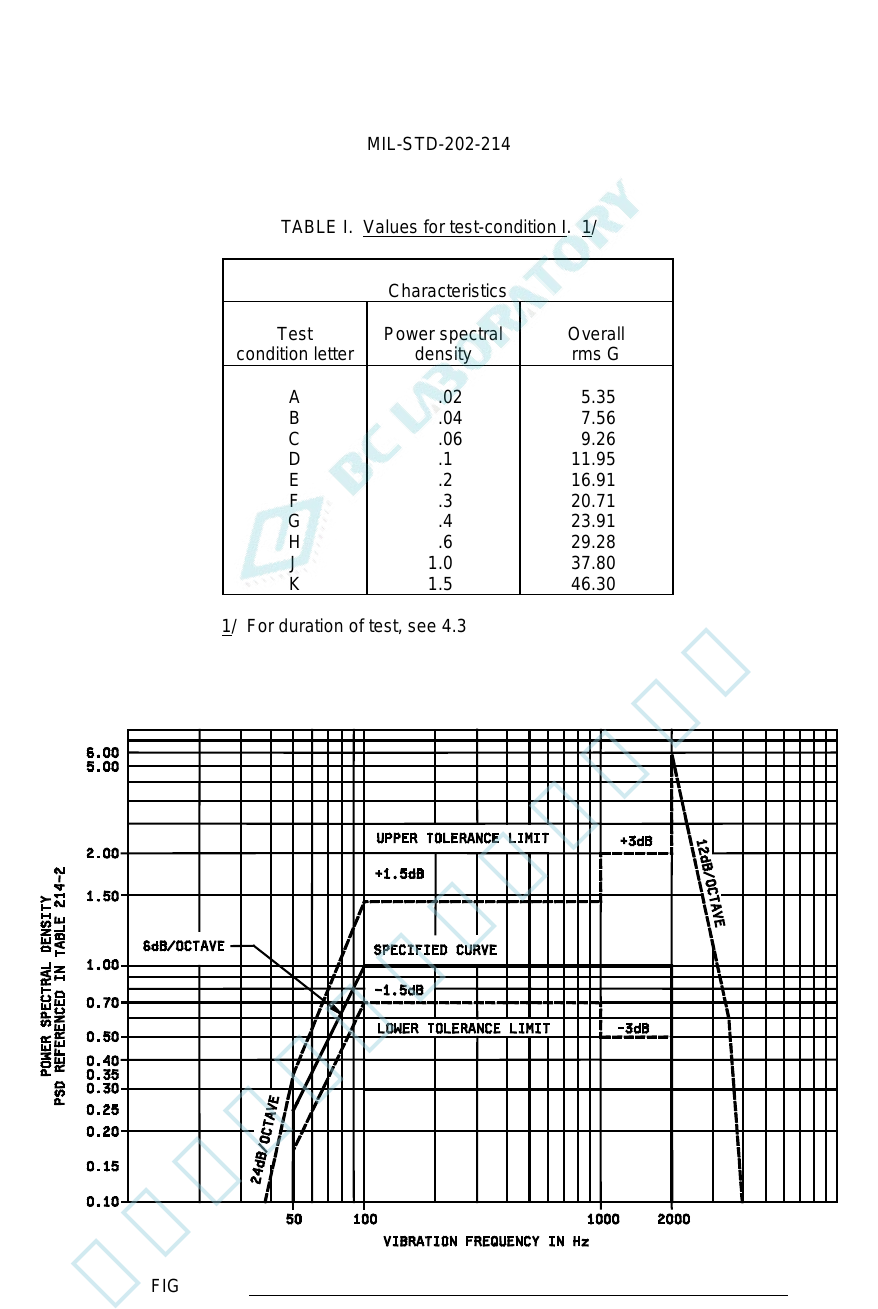
TABLE I. Values for test-condition I. 1/
Characteristics
Test
condition letter
Power spectral
density
Overall
rms G
A
B
C
D
E
F
G
H
J
K
.02
.04
.06
.1
.2
.3
.4
.6
1.0
1.5
5.35
7.56
9.26
11.95
16.91
20.71
23.91
29.28
37.80
46.30
1/ For duration of test, see 4.3
FIGURE 2. Test condition II, random vibration test-curve envelope (see table II).
4
北测(上海)电子科技有限公司
联系方式:xuyj@beice-sh.com 13917165676