IPC-D-279 EN.pdf - 第108页
Insulator/Substrate Material/System CTE lower value upper Conductor Material/System Alloy 42 4.4 Alluminum (40% Silicon) 13.5 Aluminum, T6061 23.6 Boron Aluminum (20%) 12.7 Copper , CDA 101 17.6 Copper/Invar/Copper 20/60…
Appendix G
Coefficient of Thermal Expansion
G-1.0 COEFFICIENT OF THERMAL EXPANSION
Polymer systems expand with increasing temperature, dem-
onstrating a glassy phase response with a coefficient of
thermal expansion (CTE) or α
1
below T
g
, and a rubbery
phase response with a much higher α
2
, typically 3 times α
1
above T
g
. The transition from glassy phase to rubbery
phase is gradual, but for most polymer substrates may be
characterized by T
g
, the glass transition temperature. See
IPC-T-50.
Glass fiber reinforced substrates exhibit significantly differ-
ent CTE in the z (CTE(z), out of plane) axis compared to
the CTE in the x-y axes; for example, below its T
g
, Quartz/
Bismaleimide material with 35% resin by weight exhibits a
CTE(x,y) of 6 ppm/°C and a CTE(z) of 41. Woven glass
fiber reinforcement exhibits an additional difference
between x and y axes on the order of 1-5 ppm/°C; this dif-
ference may be significant where the CTE of a large SM
component package is to be matched to the CTE of the
substrate to enhance cyclic life of the solder attachments.
The CTE(z) is particularly significant in determining the
cyclic life of PTH and vias in SM PWAs because the aspect
ratio (ratio of substrate thickness to finished hole diameter)
is generally much larger than the corresponding aspect
ratio achieved in printed boards manufactured for through
hole technologies. Higher CTE(z) values result in higher
cyclic tensile stress in the barrel of the PTH or via during
temperature excursion during SM reflow, or SM compo-
nent removal/rework/repair as well as during printed board
fabrication, solder dipping, hot air leveling, or wave solder.
See IPC-TR-579 and IPC-SM-782.
The thermal cycle reliability, vibration robustness, and the
thermal management of high performance Surface Mount
(SM) products are heavily dependent upon the constraining
core such as Copper-Molybdenum-Copper (CMC),
Copper-Invar-Copper (CIC) and Molybdenum-Graphite-
Molybdenum (MGM) composite material systems.
The ratios of the various materials in those composite sys-
tems can be adjusted to tailor the effective CTE to the opti-
mum value. The tradeoffs include weight and cost. See
IPC-MC-324.
G-2.0 CONSTRAINING CORES
A constraining core is an internal supporting plane in a
packaging and interconnecting structure, used to alter the
coefficient of thermal expansion of printed boards.
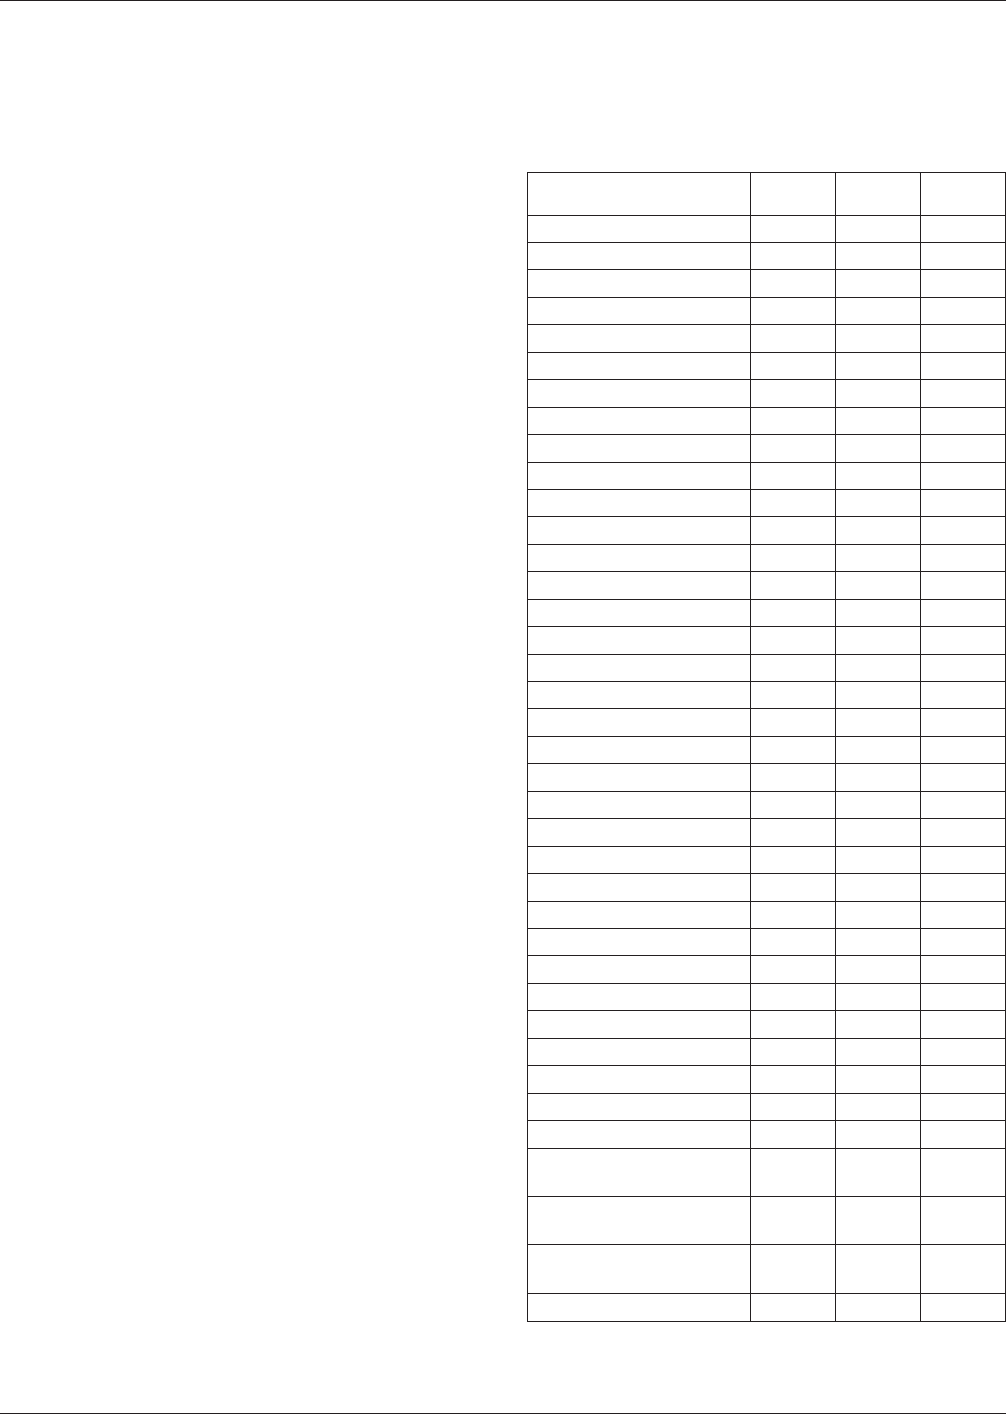
Table G−1 Typical Values for Coefficients of
Thermal Expansion (ppm/°C)
Insulator/Substrate
Material/System
CTE
lower value upper
E glass 5.5
S Glass 2.6
Glass-Ceramic > 3.0
Silicon 2.6
Diamond 0.9
Aluminum Nitride 4.5
Silicon Nitride 3.7
Quartz, fused silica 0.5 0.6
Kevlar 49 -5
Beryllia 6
Cubic Boron Nitride
x-y 3.7
z 7.2
E Glass/Epoxy
x-y 14.2 17.3
x8090
E Glass/Polyimide
x-y 12 16
z6
E Glass/PTFE
x-y 24
z 260
Kevlar/Epoxy
x-y 5.1 7.1
z 5.1 7.1
Kevlar/Polyimide
x-y 3.4 6.7
z83
Quartz/Polyimide
x-y 5.0 8.0
z 68.4
Quartz/Bismaleimide
x-y, 35% Resin 6.2 6.3
z, 35% Resin 41
Alumina (90%) TF
Substrate
7.0
Alumina (Ceramic Chip
Carrier)
5.9 6.5 7.4
Epoxy (70% Silica) Plastic
Packaging
20 23
Mulite Co-Fired 4.2
IPC-D-279 July 1996
96
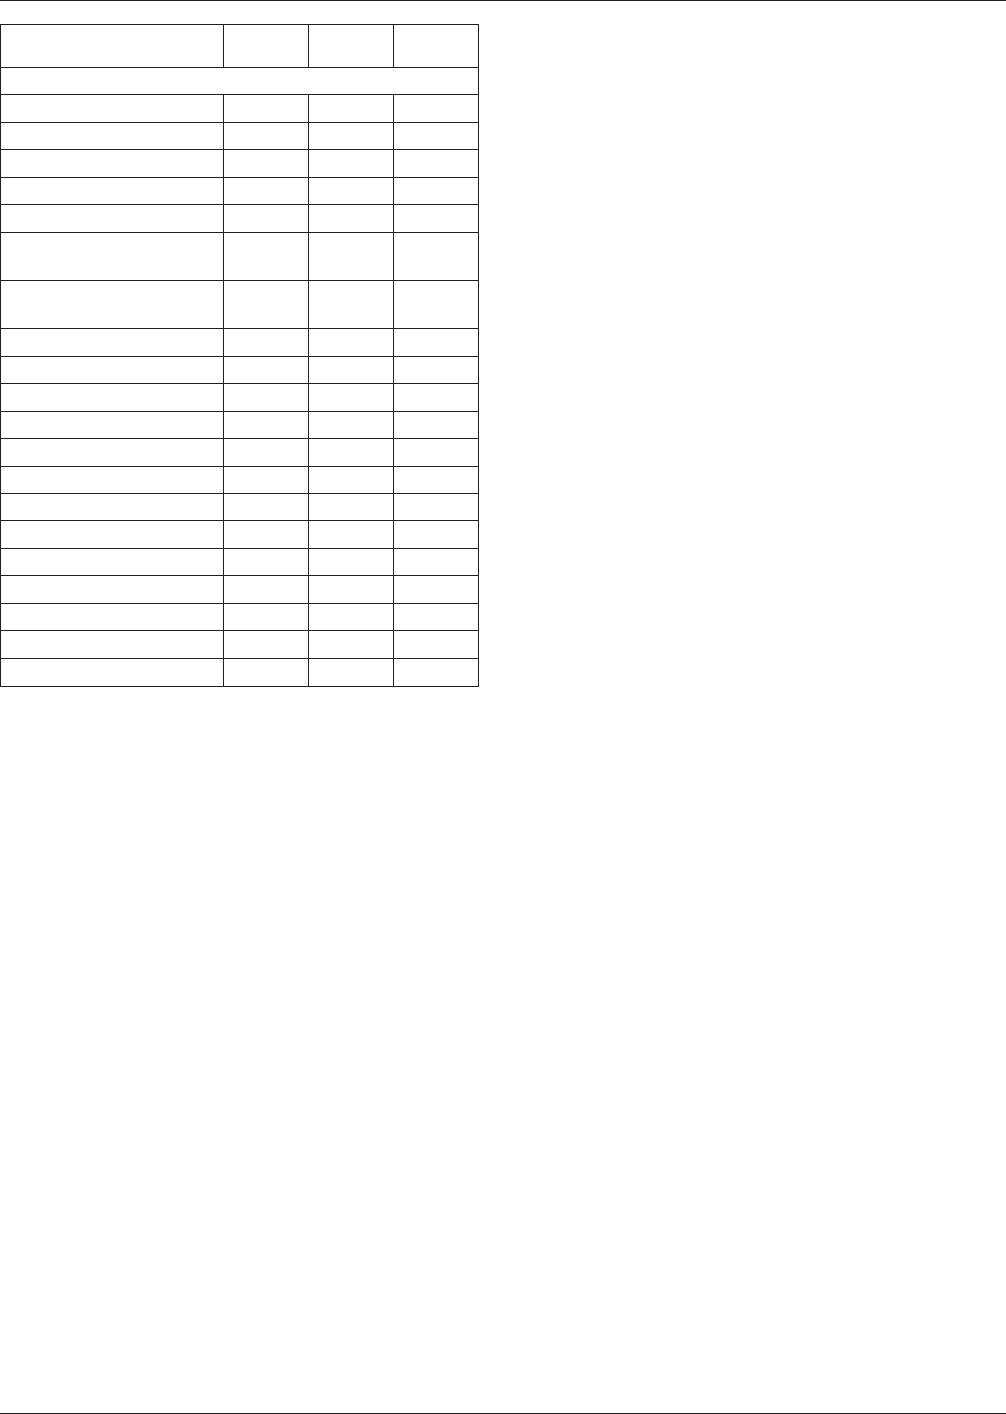
Insulator/Substrate
Material/System
CTE
lower value upper
Conductor Material/System
Alloy 42 4.4
Alluminum (40% Silicon) 13.5
Aluminum, T6061 23.6
Boron Aluminum (20%) 12.7
Copper, CDA 101 17.6
Copper/Invar/Copper
20/60/20 Thick
5.7 5.8
Copper/Molybdenum/
copper 20/60/20 Thick
7
Gold 14
Graphite/Aluminum 4 6
Invar 36 1.6
Invar 42 4.5
Kovar 5
Lead 29
Lead (95%) Tin Solder 28
Lead-Tin solder 60/40 23 25
Molybdenum 4.9
Ni-clad Molybdenum 5.2 6.0
Silver 19
Tungsten/Copper (90/10) 6.0 6.5
Tungsten 4
July 1996 IPC-D-279
97
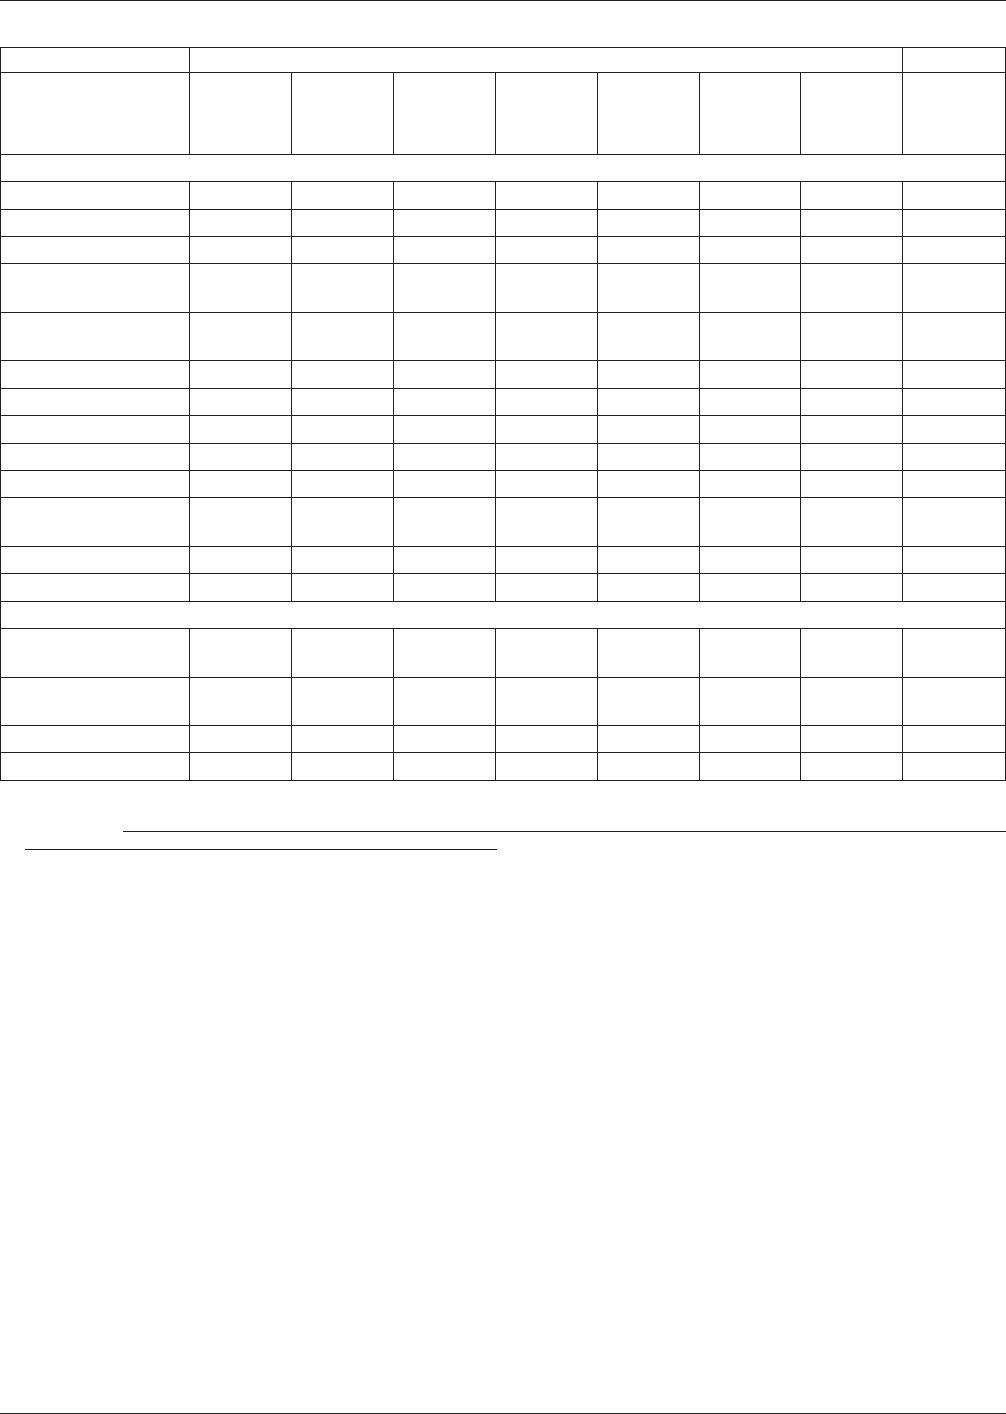
Table G−2 Properties of Printed Circuit Laminates
1
Thermal Mechanical
Material
Conductivity
W/M-K
CTE
X, Y Dir.
ppm/°C
CTE
Z. Dir
ppm/
Max. Use
Temperature
°C
Glass
Transition
Temp.
°C
Tensile
Strength
MPa
Yield
Strength M
Pa
Elongation
%
Polymer Composites:
Polyimide Glass 0.35 12-16 40-60 215-280 250-260 345 —
Epoxy Glass
(a)
0.16-0.2 14-18 180 130-160 125-135 276 —
Modified Epoxy
(b)
- 14-16 — — 140-150 — —
PTFE
(e)
Glass,
Non-Woven
0.1-0.26 20 — 230-260 — — —
PTFE
(e)
Glass,
Woven
419-837 10-25 — 248 — 38-52 —
Epoxy Aramid 0.12 6-8 66 — 125 68-103 — —
Epoxy Quartz - 6-13 62 — 125 — —
Polyimide Aramid 0.28 5-8 83 — 250 — —
Polyimide Quartz 0.35 6-12 35 — 188-250 207 —
Epoxy - Cordierite 0.9-1.3 3.3-3.8 ——————
Modified Epoxy
Aramid
— 5.5-5.6 100 — 137 — —
PTFE
(e)
Quartz — 7.5-9.4 88 — 19
(d)
——
Polyimide 4.3-11.8 45-50 — 260-315 — — — 6-7
Metal Composites:
Cu/lnvar/Cu (20/60/
20)
15-18
(c)
5.3-5.5 16 — N/A 310-414 170-270 36
Cu/lnvar/Cu (12.5/75/
12.5)
14
(c)
4.4 — — N/A 380-480 240-340
Cu/Mo/Cu 90-174 2.6 — — N/A — —
Ni/Mo/Ni 129.8
(c)
5.2-6 5.2-6 — N/A 621 552 50
(a) FR-4, G-10 (b) Polyfunctional FR-4 (c) Z-direction (d) Polymorphic p (e) PTFE=Polytetrafluoroethylene
(1) See material in Technology Assessment of Laminates, IPC-TA-720; Materials for High Density Electronic Packaging and Interconnection; ‘‘Thermal Expansion
Properties’’ chapter of Electronic Materials Handbook, Volume 1, Packaging. These values are most useful when accompanied by an indication of the ratio of
reinforcement to matrix. The chemical combination of epoxy and polyimide yields bismaleimide.
IPC-D-279 July 1996
98