IPC-D-279 EN.pdf - 第66页
the stif fness of the MLB structure surrounding the PTV barrel. The degree of land rotation—and thus lower stif fness—and any other stif fening structures, such as rein- forcement weave, neighboring PTVs, components and …

subsequent thermal excursions serve to propagate such
cracks to complete separation and failure.
B-1.3.3 Impact of Test Procedures and Cyclic Operating
Environments
During cyclic temperature testing and
operational use of the product, cyclic thermal excursions
can also lead to fractures and failure due to cyclically accu-
mulating fatigue damage. The severity of the fatigue dam-
age is dependent on the severity of the operational environ-
ment of the application. In Table A-1 guidelines as to the
possible use environments for nine of the more common
electronic applications are illustrated. The fatigue damage
caused first by the thermal excursions during processing
and assembly, then by cyclic temperature testing, and
finally during product use is cumulative and needs to be
accounted for in a reliability analysis.
B-2.0 RELIABILITY PREDICTION MODELING
The fatigue behavior of metals can be described by [Refs.
B-7: 21, 22]
N
f
−0.6
D
f
0.75
+0.9
S
u
E
[
exp(D
f
)
0.36
]
0.1785log
10
5
N
f
−∆ε = 0
(Eq. B-1)
where
N
f
= mean fatigue life, cycles-to-failure,
D
f
= fracture ductility, plastic strain at fracture, of the PTV
copper deposit,
S
u
= tensile strength of the PTV copper deposit,
E = modulus of elasticity of the PTV copper deposit,
∆ε = total cyclic strain range.
The relationships underlying Equation B-1 were developed
to be able to predict the fatigue life from tensile properties
and brought about a unified ductility-dependent low-cycle
fatigue and strength-dependent high-cycle fatigue [Ref.
B-7: 23] approach. Equation B-1 has been used for some
major study programs [Refs. B-7: 2, 11, 24] and the devel-
opment of test methods [Refs. B-7: 12, 13].
The full determination of the stresses and strains in the
PTV barrel requires a complex and expensive FEA [Refs.
B-7: 7-10] which goes significantly beyond the needs for a
reliability estimate. For the purposes of DfR and a reliabil-
ity estimate, the stresses and strains can be estimated with
adequate accuracy using a practical engineering approach
[Ref. B-7: 10]. The closed form approach, given below,
assumes no land rotation—a conservative assumption—and
calculates the average stresses and strains assuming a uni-
form stress and strain distribution. This last assumption is
non-conservative; corrections (see Eqs. B-11 through
B-14), based on empirical test results, need to be applied.
Depending on the magnitude of the PTV barrel deforma-
tion, the average stresses are calculated by
σ
avg
=
(α
E
−α
Cu
)∆TA
E
E
E
E
Cu
A
E
E
E
+A
Cu
E
Cu
, for σ
avg
≤ S
y
(Eq. B-2)
or
σ
avg
=
[
(α
E
−α
Cu
)∆T+S
y
E
Cu
−E
Cu
≠
E
Cu
E
CU
≠
]
A
E
E
E
E
Cu
≠
A
E
E
E
+A
Cu
E
Cu
≠
, for σ
avg
>S
y
(Eq. B-3)
where
A
E
=
π
4
[d
E
2
−d
2
]
(Eq. B-4)
and
A
Cu
=
π
4
[d
2
−(d−2t)
2
]
(Eq. B-5)
and where
σ
avg
= PTV barrel stress;
S
y
= PTV barrel copper yield strength, typically ~172
MPa;
α
E
= CTE of MLB in thickness direction, for excursions
above T
g
the larger CTE at those temperatures
needs to be considered, typically ~65 ppm/°C @
<T
g,
315 ppm/°C @ >T
g
;
α
Cu
= CTE of copper, typically ~18 ppm/°C;
∆T = temperature range of thermal cycling;
A
E
= area of loading influence of MLB;
A
Cu
= area of PTV barrel;
E
E
= modulus of elasticity of epoxy, typically ~3.5 GPa;
E
Cu
= modulus of elasticity of PTV copper, typically ~83
GPa for acid- plated copper and 35 ~GPa for
pyrophosphate-plated copper;
E
Cu
≠ = modulus of elasticity of PTV copper, typically
~0.7 GPa;
h = thickness of MLB;
d = drilled PTV diameter;
d
E
= diameter of MLB dielectric surrounding the PTV
and influencing the PTV loading;
t = thickness of copper deposit in PTV barrel.
The average strains in the PTV barrel are determined from
∆ε
avg
=
(α
E
−α
Cu
)∆TA
E
E
E
A
E
E
E
+A
Cu
E
Cu
, for σ
avg
≤ S
y
(Eq. B-6)
and
∆ε
avg
=
(α
E
−α
Cu
)∆TA
E
E
E
−S
y
A
Cu
E
Cu
−E
Cu
≠
E
Cu
A
E
E
E
+A
Cu
E
Cu
≠
, for σ
avg
> S
(Eq. B-7)
where
∆ε
avg
= the cyclic strain range during thermal cycling.
The diameter of MLB dielectric material surrounding a
PTV and influencing the PTV loading, d
E,
is a measure of
IPC-D-279 July 1996
54

the stiffness of the MLB structure surrounding the PTV
barrel. The degree of land rotation—and thus lower
stiffness—and any other stiffening structures, such as rein-
forcement weave, neighboring PTVs, components and
cooling plates, will have an impact on this stiffness. For
bare MLBs it was found that d
E
could vary from a rela-
tively small diameter of influence [Ref. B-7: 10]
d
E
≅ 3d (Eq. B-8)
for softer structures to possibly a very large diameter of
influence [Ref. B-7: 10]
d
E
≅ 2h (Eq. B-9)
for PTVs in MLB assemblies for which land rotation is
essentially prevented by large stiff components and heat
sink plates; the most probable representative value for bare
MLBs is [Ref. B-7: 10]
d
E
≅
h
2
+ 2d
(Eq. B-10)
It has been found [Refs. B-7: 2,7,10] that the average bar-
rel strains, ∆ε
avg
, thus calculated need to undergo a correc-
tion for the assumptions necessary for a closed form stress
and strain analyses. Further, stress concentrations can occur
due to the uneven PTV barrel geometries resulting from
inadequate drilling and/or plating processes. In addition,
localized differences in the resin content (B-stage layers)
and the influence of inner lands and power and ground
planes can cause non-uniformities in the stresses and
strains, and at temperatures above T
g
, the material proper-
ties of the polymeric dielectric materials change dramati-
cally and abruptly [Ref. B-7: 10].
Furthermore, PTV failures, as all failures due to wearout
mechanisms, have a statistical distribution. The available
data are not adequate to fully define this statistical distribu-
tion, but wearout mechanisms like fatigue typically follow
a Weibull distribution with a shape parameter or slope of
β≈3. Typical data are reported as the first failure from a
number of daisy chains with upwards of 100 PTVs each.
An effective maximum strain range to be used in Eq. B-1
can be found from
∆ε
max
(eff) = K
eff
∆ε
avg
(Eq. B-11)
where K
eff
, the effective PTV strain coefficient, results
from a combination of discernible deviations from a uni-
form stress and strain distribution, such that
K
eff
= K
d
K
b
100
K
c
10
K
Q
(Eq. B-12)
The coefficients in Eq. B-12 are the PTV strain distribution
factor, K
d
, the plating thickness ‘dog-boning’ coefficient,
K
b
, the PTV stress concentration factor, K
c
, and the PTV
plating quality index, K
Q
. Initially, the last three coeffi-
cients had been combined in a general PTV quality index
[Ref. B-7: 2], but by separating the discernible quality
variations, the source of the reduced quality can be identi-
fied and the impact less arbitrarily quantified. As a guide-
line it should be noted that the values for K
eff
in Reference
B-7:2 varied between about 1.2 and 10.
The PTV strain distribution factor, K
d
, corrects for the
model assumption of a uniform stress and strain distribu-
tion for a distribution that is in fact non-uniform. The non-
uniformity is a function of the MLB thickness, h, with
higher non-uniformities resulting from thicker MLBs. The
PTV strain distribution factor is also dependent on whether
or not the temperature excursions exceed T
g
, above which
not only the thermal expansion increases, but the materials
softens significantly. Thus
1,T
max
> 200°C, any T
g
K
d
= 1+1.5
(
h
2.3 mm
)
3
T
max
− T
g
200 − T
g
,T
max
> T
g
,
1+1.5
(
h
2.3 mm
)
3
, otherwise
(Eq. B-13)
The plating thickness ‘dog-boning’ coefficient, K
b
,
accounts for any non-uniform stress and strain distribution
in the PTV barrel due to the gradual thinning—‘dog-
boning’—of the copper deposit towards the barrel center.
This ‘dog-boning’ can result from plating conditions that
are slightly beyond the capability of the plating chemistry
used. The coefficient is given by [Ref. B-7: 10]
K
b
=
t
PTV shoulder
t
PTV center
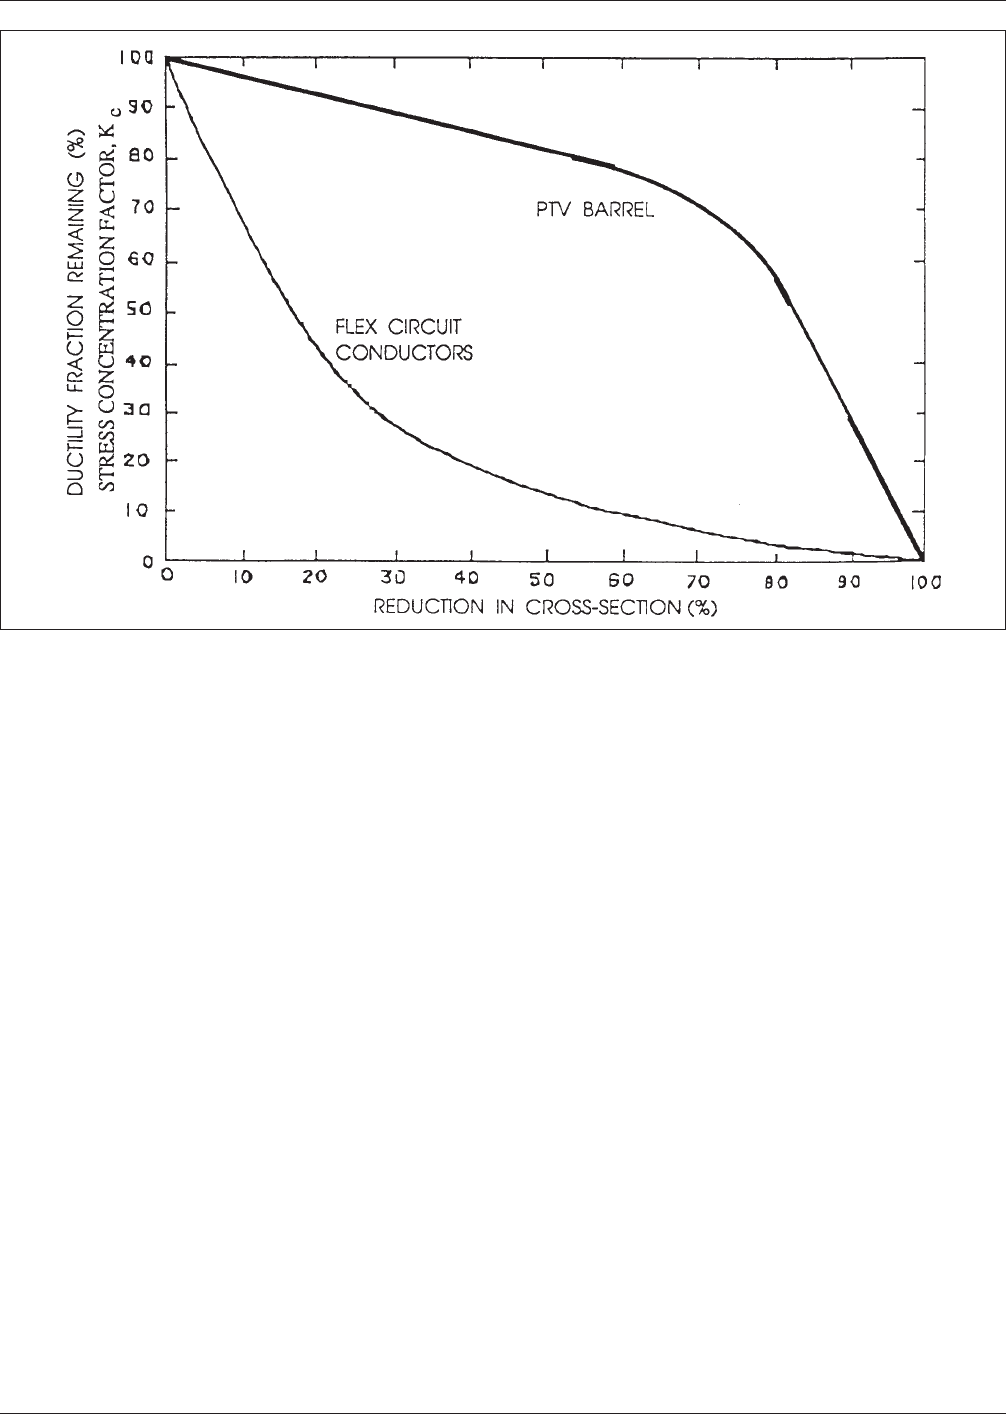
The PTV stress concentration factor, K
c
, is a measure of
the stress concentrations caused by the localized abrupt
thinning of the copper deposit due to either drilling or plat-
ing defects. Its size may be taken from Figure B-3 using
the plating deposit narrowing to determine the local ‘reduc-
tion in cross-section’.
Figure B-3 contains a curve [Ref. B-7: 10] which quanti-
fies the large impact stress concentrations due to localized
thinning of plated copper conductors on flexible printed
wiring have on increasing the stress—and thus the strain—
locally. PTV copper barrels, however, due to their three-
dimensional geometric structure are less susceptible to
stress concentrations that occur as localized features visible
on two-dimensional cross-sections. Figure B-3 also con-
tains a curve which is an attempt to quantify the impact of
these localized stress concentrations, which do not affect
the whole PTV barrel cross-section, in terms of the portion
of the basic material ductility that is required to accommo-
date these stress concentrations. From Figure B-3 a local-
ized reduction in plating thickness by 50% would result in
a value for K
c
of about 82, raising the effective strain due
to the stress concentration by about a factor of 1.22.
The PTV plating quality index, K
Q
, is on a 10-to-1 scale
July 1996 IPC-D-279
55
with 10 being perfect, and is a measure of the quality of the
plated copper deposit in terms of its material properties
relative to those of a corresponding foil sample plated onto
a plating mandrel. This index needs to be established by
experience with PTVs in coupons or MLBs fatigued to
failure.
B-3.0 DfR-PROCESS
A successful ‘Design for Reliability’-process requires that
a number of issues be addressed at the design stage. The
generally applicable guidelines for the DfR-process are;
1) Keep PTV diameters as large as possible and the
MLB thickness/PTV diameter aspect ratio as small
as possible;
2) Require a nominal copper deposit thickness of 30 µm
to obtain actual plating thicknesses in the range of 25
to 40 µm;
3) Use E3 copper foil for the signal, power, and ground
layers for aspect ratios larger than 3:1;
4) Tent PTVs for applications with severe operational
loading conditions (see Table B-2) with solder mask
to prevent solder from partially filling the PTVs and
causing stress concentrations.
It is much more difficult to plate consistent high quality
copper deposits into small-diameter PTVs using standard
electrolytic processes. Also, smaller diameter PTV barrels,
especially in thicker MLBs, are subjected to higher loading
conditions.
A plating thickness of ~25 µm has been found to be the
minimum thickness which gives good reliability; a plating
thickness of ~40 µm is optimum from a reliability perspec-
tive. Plating thicknesses greater than that tend to promote
shoulder fractures (see Fig. B-2).
The quality of the copper foil for the signal, power, and
ground layers is of importance for aspect ratios larger than
about 3:1. Standard E1 copper foil [Ref. B-7: 14] has a
coarse columnar grain structure with the grain boundaries
perpendicular to the foil surfaces and has an elongation
requirement of only 2%. Thus, brittle E1 vendor foil can
lead to signal layer fractures and shoulder cracks as illus-
trated in Figure B-2. ‘High Temperature Elongation’ -E3
copper foil is recommended for PTVs with aspect ratios
larger than about 3:1.
Tenting the PTVs is a prudent and pragmatic decision.
PTVs entirely filled with solder certainly are more robust
and reliable than PTVs without solder; the problem is that
it cannot be guaranteed, that all the PTVs will be entirely
filled with solder. Partially solder-filled PTVs have stress
concentrations where the transition from fully filled to par-
tially filled occurs; these stress concentrations reduce the
Figure B−3 Reduction of Available Copper Ductility Due to Localized Nicks Reducing the Width of the Flex Circuit
Conductors [Ref. B-7: 25] and PTV Stress Concentration Factor, K
c
.
IPC-D-279 July 1996
56