IPC-D-279 EN.pdf - 第50页
−20°C to +20°C, in which the change from stress- to strain-driven solder response takes place, do not follow the damage mechanism described in Eqs. #1 and #2 [Ref. A-9: 34]. The damage mechanism is dif ferent than for mo…
pad centers, L
D
is sometimes referred to as the
distance from the neutral point (DNP);
T
C
,T
S
= steady-state operating temperature for compo-
nent, substrate (T
C
>T
S
for power dissipation in
component) during high temperature dwell;
T
C,0
,T
S,O
= steady-state operating temperature for compo-
nent, substrate during low temperature dwell,
for non-operational (power off) half-cycles
T
C,O
=T
S,0
;
T
SJ
= (1/4)(T
C
+T
S
+T
C,O
+T
S,O
), mean cyclic solder
joint temperature;
α
C,
α
S
= CTEs for component, substrate;
∆D = potential cyclic fatigue damage at complete
stress relaxation;
∆T
C
=T
C
−T
C,O
, cyclic temperature swing for compo-
nent;
∆T
S
=T
S
−T
S,O
, cycling temperature swing for sub-
strate (at component);
∆(α∆T) = ?α
S
∆T
S
−α
C
∆T
C
?, absolute cyclic expansion
mismatch, accounting for the effects of power
dissipation within the component as well as
temperature variations external to the compo-
nent;
∆α = ?α
C
−α
S
?, absolute difference in CTEs of com-
ponent and substrate, CTE-mismatch, because
of the inherent variability in material proper-
ties ∆α<2x10
-6
should not be used in calculat-
ing reliability.
A-3.3 CAVEAT 1 — Solder Joint Quality
The solder joint fatigue behavior and the resulting reliabil-
ity prediction equations. Eqs. A-1 through A-2, were deter-
mined from thermal cycling results of solder joints that
failed as a result of fracture of the solder, albeit sometimes
close to the IMC layers. For solder joints for which layered
structures are interposed between the base material and the
solder joints, these equations could be optimistic upper
bounds if the interposed layered structures become the
‘weakest link’ in the surface mount solder attachments.
Such layered structures could be: metallization layers that
have weak bonds to the underlying base material, or are
weak themselves, or dissolve essentially completely in the
solder; oxide or contamination layers preventing a proper
metallurgical bond of the solder to the underlying metal;
brittle IMC layers too thick due to too many or improperly
long high temperature processing steps.
Some material choices can lead to lower quality and
weaker solder joints because the material is more difficult
to wet and solder. The nickel/iron alloys, Kovar
TM
and
Alloy 42, fall into this material category. The resulting
lower solder joint quality indicated in Table A-2 is also
clearly evident in Figure A-2, where the solder joint pull
strength is shown for a variety of differently prepared
Alloy 42 and copper leads. Alloy 42 leads, even when
etched or pre-flowed at temperatures higher than can be
tolerated by the component, show a substantial reduction in
the solder joint pull strength relative to copper. In the worst
instance, the leads from one Alloy 42 manufacturer have a
pull strength of less than half of those with more typical
Alloy 42 and are essentially non-wettable.
Early failures of the solder attachments of components with
Alloy 42 lead frames and leads during accelerated testing
[Refs. A-9: 26-30] and manufacture [Ref. A-9: 31] have
been documented.
Solder joints which have solder joint heights (gaps) of
h<50 to 75µm also require special attention. For solder
joints that thin, the gap is essentially filled with intermetal-
lic compounds and those solder metals that do not go into
solution with the base metals to form the IMCs. Therefore
Eqs. A-1 and A-2 do not apply because these gaps are not
filled with solder [Ref. A-9: 32]. These materials do not
creep as readily, if at all, at the prevailing temperatures and
are typically more brittle, but much stronger than solder.
Thus, fatigue lives are longer than would be predicted from
Eqs. A-1 and A-2 unless overstress conditions occur.
On the other hand, the fatigue lives of solder attachments
can be underestimated by Eqs. A-1 through A-4 if the com-
ponent is underfilled with a load-bearing substance, e.g.,
epoxy [Ref. A-9: 33]. Components that are glued-down to
the substrate result in higher solder joint fatigue reliability,
since the solder joints are loaded in compression when the
adhesive contracts on cooling from the solder reflow tem-
peratures. Covercoats can either increase or decrease solder
joint fatigue lives depending on the properties of the cover-
coat and when and how it is applied. Parylene
TM
has been
found to increase the solder joint fatigue life by about a
factor of three.
In general, caution might be indicated in all instances
where the predicted life is less than 1000 cycles, because
the severe loading conditions producing such short lives
are likely to produce different damage mechanisms or/and
failure modes.
A-3.4 CAVEAT 2 — Large Temperature Excursions
Solder joints experiencing large temperature swings
(−50°C to + 80°C) which extend both significantly below
and significantly above the temperature region bounded by
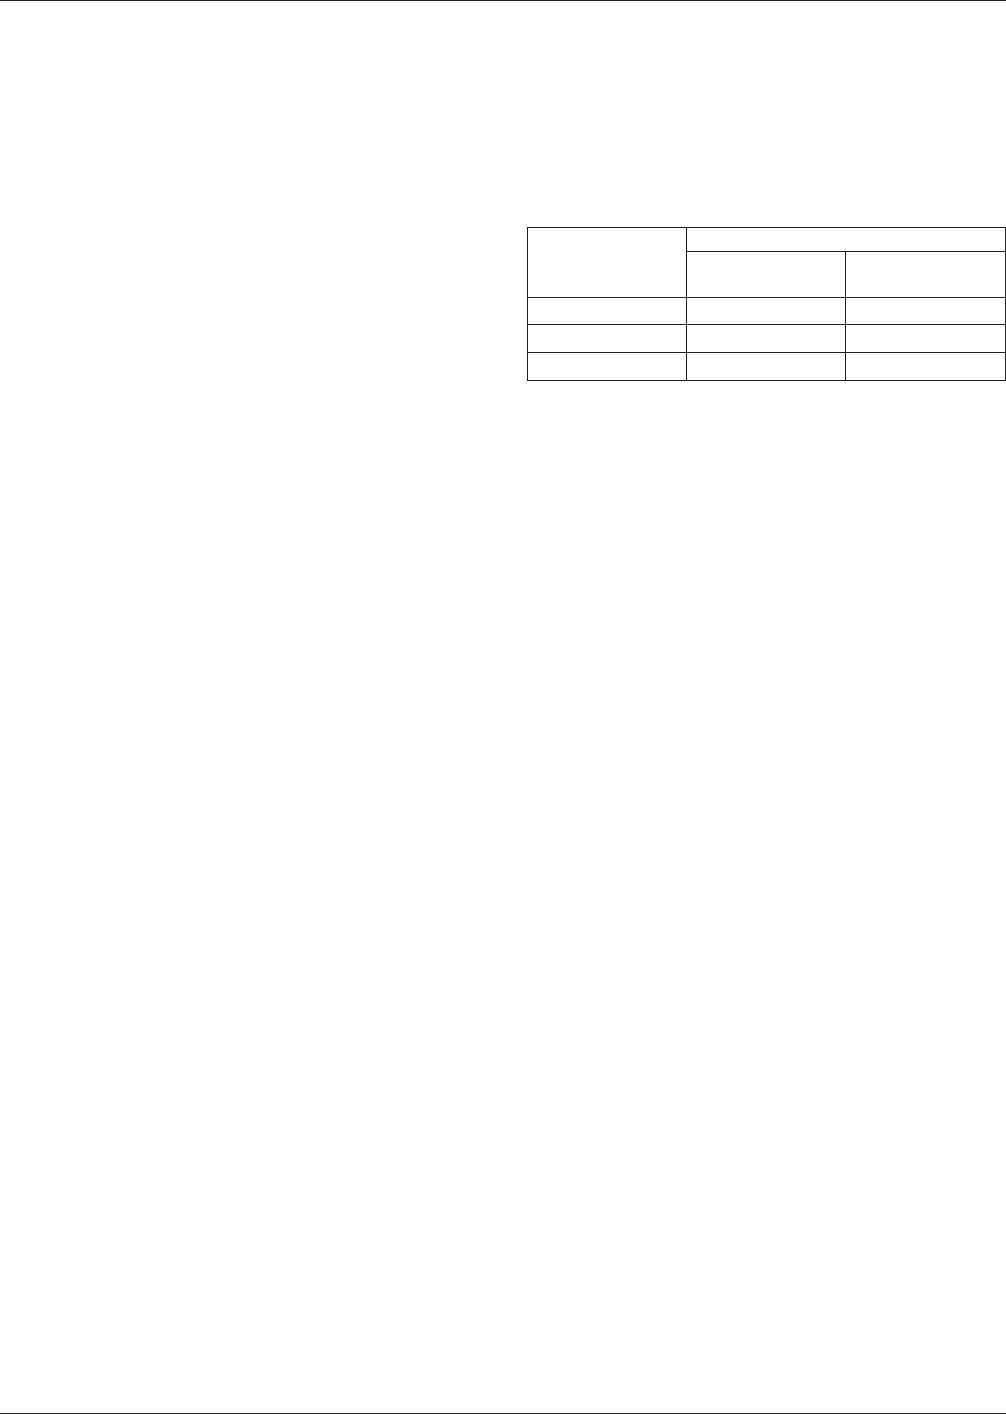
Table A−2 Quality of Solder Joints with Copper and
Alloy 42 Resulting from Different Reflow Temperatures
Reflow
Temperature
°C
Solder Joint Quality
60/40 Solder to
Copper
60/40 Solder to
Alloy 42
~210 just o.k. marginal to bad
~240 good just o.k.
~260 good good
IPC-D-279 July 1996
38

−20°C to +20°C, in which the change from stress- to
strain-driven solder response takes place, do not follow the
damage mechanism described in Eqs. #1 and #2 [Ref. A-9:
34]. The damage mechanism is different than for more
typical use conditions and is likely dependent on a combi-
nation of creep-fatigue, causing early micro-crack forma-
tion, and stress concentrations at these micro-cracks caus-
ing faster crack propagation during the high stress cold
temperature excursions, as well as recrystallisation consid-
erations.
A-3.5 CAVEAT 3 — High-Frequency/Low-Temperatures
For high-frequency applications, f>0.5 Hz or t
D
<l s, e.g.,
vibration, and/or low temperature applications, T
C
< 0°C,
for which the stress relaxation and creep in the solder joint
is not the dominant mechanism, the direct application of
the Coffin-Manson [Ref. A-9: 14] fatigue relationship
might be more appropriate. This relationship is
N
f
(50%)=
1
2
[
2e
f’
∆γ
p
]
−1
c
[Eq. A-5]
where ∆γ
p
is the cyclic plastic strain range and c ≈ −0.6.
It has to be noted, that the determination of ∆γ
p
depends on
the expansion mismatch displacements and the separation
of the plastic from the elastic strains.
For loading conditions of this character, it is possible that
high-cycle fatigue behavior may be observed.
A-3.6 CAVEAT 4 — Local Expansion Mismatch
For applications for which the global thermal expansion
mismatch is very small, e.g. ceramic-on-ceramic or silicon-
on-silicon (flip-chip solder joints), the local thermal expan-
sion mismatch becomes the primary cause of fatigue dam-
age. Equation A-4 does not address the local thermal
expansion mismatch. This reliability problem needs to be
assessed using an interfacial stress analysis [Ref. A-9: 35]
and appropriate accelerated testing.
For leaded surface mount components with lead materials
that have CTEs significantly lower than copper alloy mate-
rials, e.g., Kovar
TM
or Alloy 42, the results from Eqs. A-1
and A-2 will be optimistic, since the fatigue damage con-
tributions from the solder/lead material CTE-mismatch, the
local thermal expansion mismatch, are not included.
It has shown that the interfacial stresses resulting from the
local expansion mismatch follow [Ref. A-9: 35].
τ∝L (α
Solder
−α
Basr
)(T
max
− T
min
)
[Eq. A-6]
Figure A−2 Solder Joint Pull Strengths for Gullwing Leads Consisting of Alloy 42 from Different Vendors and Copper
[Ref. A-9: 31]
July 1996 IPC-D-279
39

where L is the wetted length of the solder joint. In addition,
besides substantial shear stresses at the interface between
the solder joint and the base material to which it is wetted,
even larger peeling stresses occur. Both of these stresses
are proportional to the parameters given in Eq. A-6.
From Eq. A-6 it is quite clear, that for leads consisting of
Alloy 42, the wetted length of the solder joint, that is the
length of the lead foot should be minimized to reduce inter-
facial stresses. That, of course, is contrary to the good
practice that the foot length should be at least three times
the lead width for optimum solder joint quality. However,
since in most applications, the local expansion mismatch
results in contributory damage to the more important dam-
age caused by the global expansion mismatch, this contra-
indication can be ignored without suffering catastrophic
consequences.
From the available experimental data, the damage term, to
be used in Eq. A-1, for the local expansion mismatch alone
is
∆D(local)=
[
L∆α∆T
L
0
]
[Eq. A-7]
where the parameters are the same as in Eq. A-6 and
L
0
=0.1 mm, a scaling wetted length. The local expansion
mismatch is then treated as an additional loading condition
(see sections A-3.9 & A-3.10).
A.3.7 CAVEAT 5 — Very Stiff Leads/Very Large Expan-
sion Mismatches
Equations A-3 and A-4 differentiate between surface mount
solder attachments that are leadless and those with compli-
ant leads. Leadless solder attachments presume substantial
plastic strains due to yielding prior to creep and stress
relaxation, whereas Eq. A-4 assumes that the compliant
leads prevent stresses in the solder joints to reach levels
where substantial yielding, and thus plastic strains prior to
creep and stress relaxation, can take place.
However, there is an intermediate region that is not cov-
ered by these assumptions. For very stiff, non-compliant
leads (e.g., SM connector headers), perhaps at lead stiff-
nesses K
D
> ~90 N/mm and/or for very large thermal
expansion mismatches (e.g., ceramic MCMs on FR-4)
resulting in strain ranges ∆γ > ~10%, the damage estimates
in Eq. A-4 can be substantially in error, because the
assumptions underlying Eq. A-4 are violated.
For very stiff leads the stresses calculated in Eq. A-4 can
exceed the yield strength of the solder. Since yielding will
not permit stresses significantly higher than the yield
strength, these calculated stress ranges will overestimate
the cyclic fatigue damage and thus result in substantially
underpredicted fatigue lives. To prevent this analytical
error, the stress range in Eq. A-4 needs to be bounded by
the yield strength of solder in shear.
For very large thermal expansion mismatches the full dis-
placements will not be transmitted to the solder joints,
because the leads will accommodate displacements by plas-
tic deformations of the lead material. Possible exceptions
are situations where very stiff leads are also involved, in
which case the solder joint reliability is best estimated
using Eq. A-1 for leadless solder attachments. The strain
range that can be accommodated by creep and stress relax-
ation in the solder joints can be significantly exceeded by
the displacements resulting from very large thermal expan-
sion mismatches and the cyclic fatigue damage would be
significantly overestimated. Under these conditions FEA is
required to determine the split in the accommodation of the
displacements between the lead and the solder joints.
Under these circumstances, Eqs. A-3 and A-4 will provide
lower and upper bounds for the reliability estimates,
respectively. The higher the lead stiffness, the closer the
expected results will be towards the results given by Eq.
A-3 for the leadless—‘infinitely stiff leads’—solder attach-
ments. Very high lead stiffnesses can occur in the case of
through-hole component leads converted to surface mount
and for connector headers where the male header pins have
been simply bent into a gull-wing lead foot without any
reduction in the lead cross-section. Very high thermal
expansion mismatches occur primarily in accelerated test-
ing and in extraordinary environments like storage and
transport for products that are designed for benign operat-
ing environments.
A.3.8 Statistical Failure Distribution and Failure Prob-
ability
While the physical parameters define the median cyclic
fatigue life from physics-of-failure considerations, solder
attachment failures for a group of identical components
will follow a distribution—like all fatigue results—which
typically is best described by a Weibull statistical distribu-
tion [Ref. A-9: 36]. Given the statistical distribution, the
fatigue life at any given failure probability for the solder
attachment of a component can be predicted as long as the
slope of the Weibull distribution is known. Thus, the
fatigue life of surface mount solder attachments at a given
acceptable cumulative failure probability per component, x,
is —assuming a two-parameter (2P) Weibull statistical
distribution—given by
N
f
(x%)=N
f
(50%)
[
1n(1 − 0.01x)
1n(0.5)
]
1
β
[Eq. A-8]
where β = Weibull shape parameter or slope of the
Weibull probability plot; typically β≈3 for
fatigue tests, from low-acceleration tests of
stiff leadless solder attachments β≈4 and ≈2
for compliant leaded attachments.
IPC-D-279 July 1996
40