Utah-94-721002-System-Manual.pdf - 第94页
mä~ëã~ä~Ä póëíÉãNMM lñÑçêÇ =fåëíêìã Éåíë= mä~ëã~ =qÉÅÜåçäçÖó == System Manual RKSKO= oìå=äçÖ=é~ÖÉ= The Run Log page is accessed from the Select Run page by clicking on the View Run button with any process run other than …
System Manual lñÑçêÇ=fåëíêìãÉåíë=mä~ëã~=qÉÅÜåçäçÖó== mä~ëã~ä~ÄpóëíÉãNMM
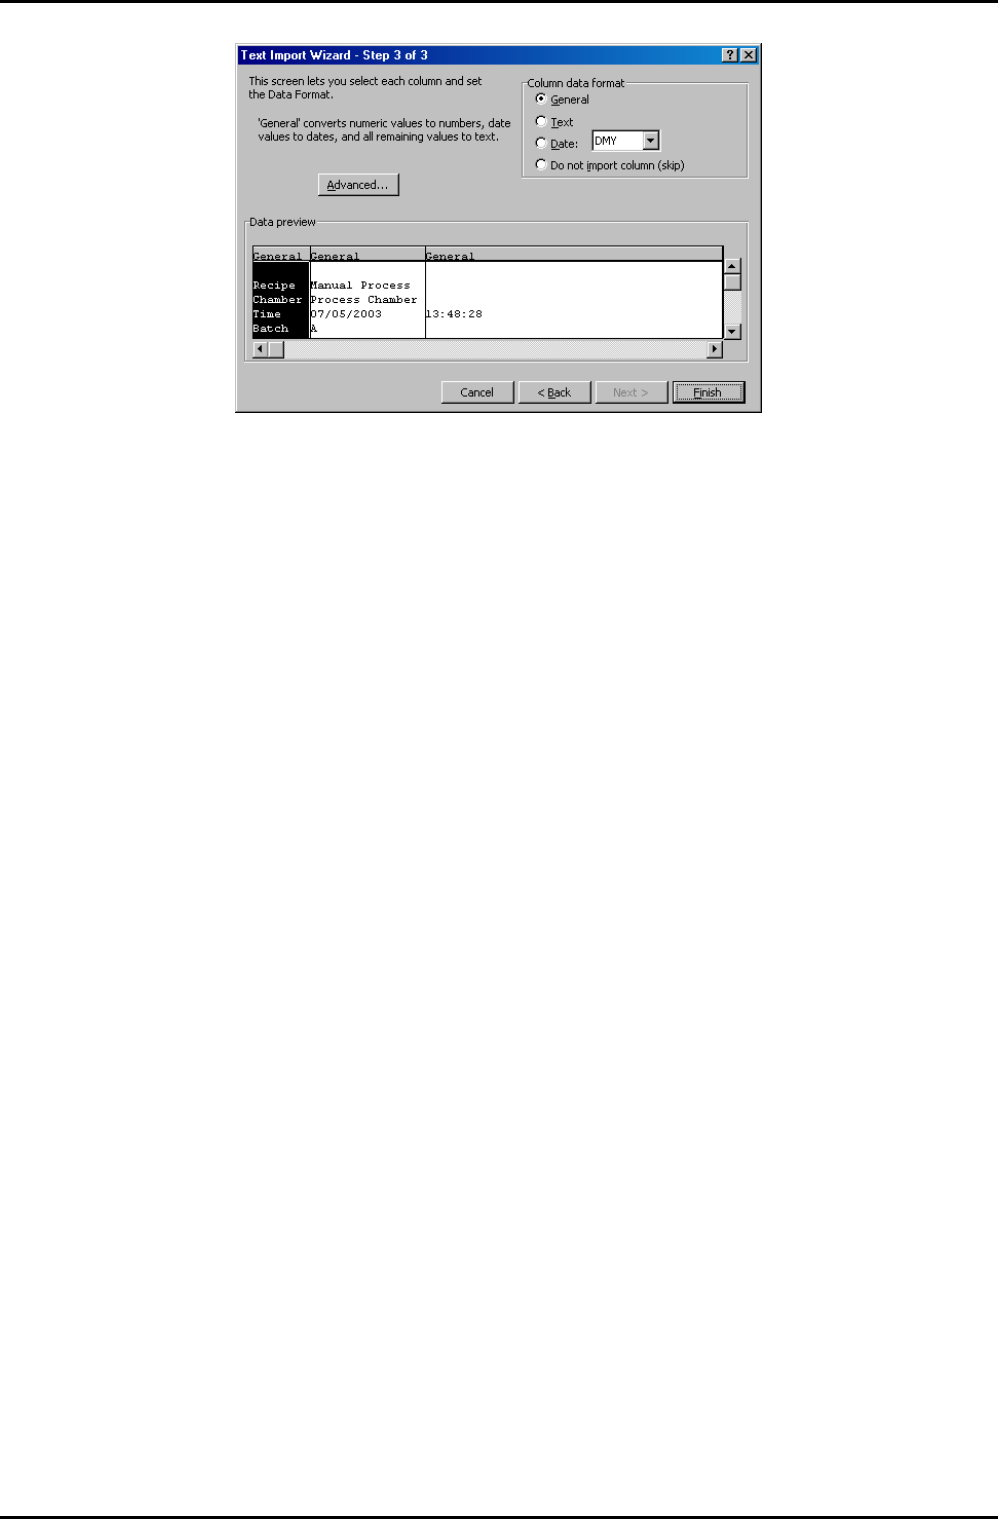
9) In the ‘Column data format’ panel, ensure that the ‘General’ option is selected and
then select the Finish button. The process run log data is now displayed in the Excel
worksheet.
10) Adjust the column widths so that all text is visible and then save the spreadsheet.
Operating Instructions
Printed: 22-Mar-06, 10:42 Page 5-27 of 52 UC Davis 94-721001 Issue 1: March 06
mä~ëã~ä~ÄpóëíÉãNMM lñÑçêÇ=fåëíêìãÉåíë=mä~ëã~=qÉÅÜåçäçÖó== System Manual
RKSKO= oìå=äçÖ=é~ÖÉ=
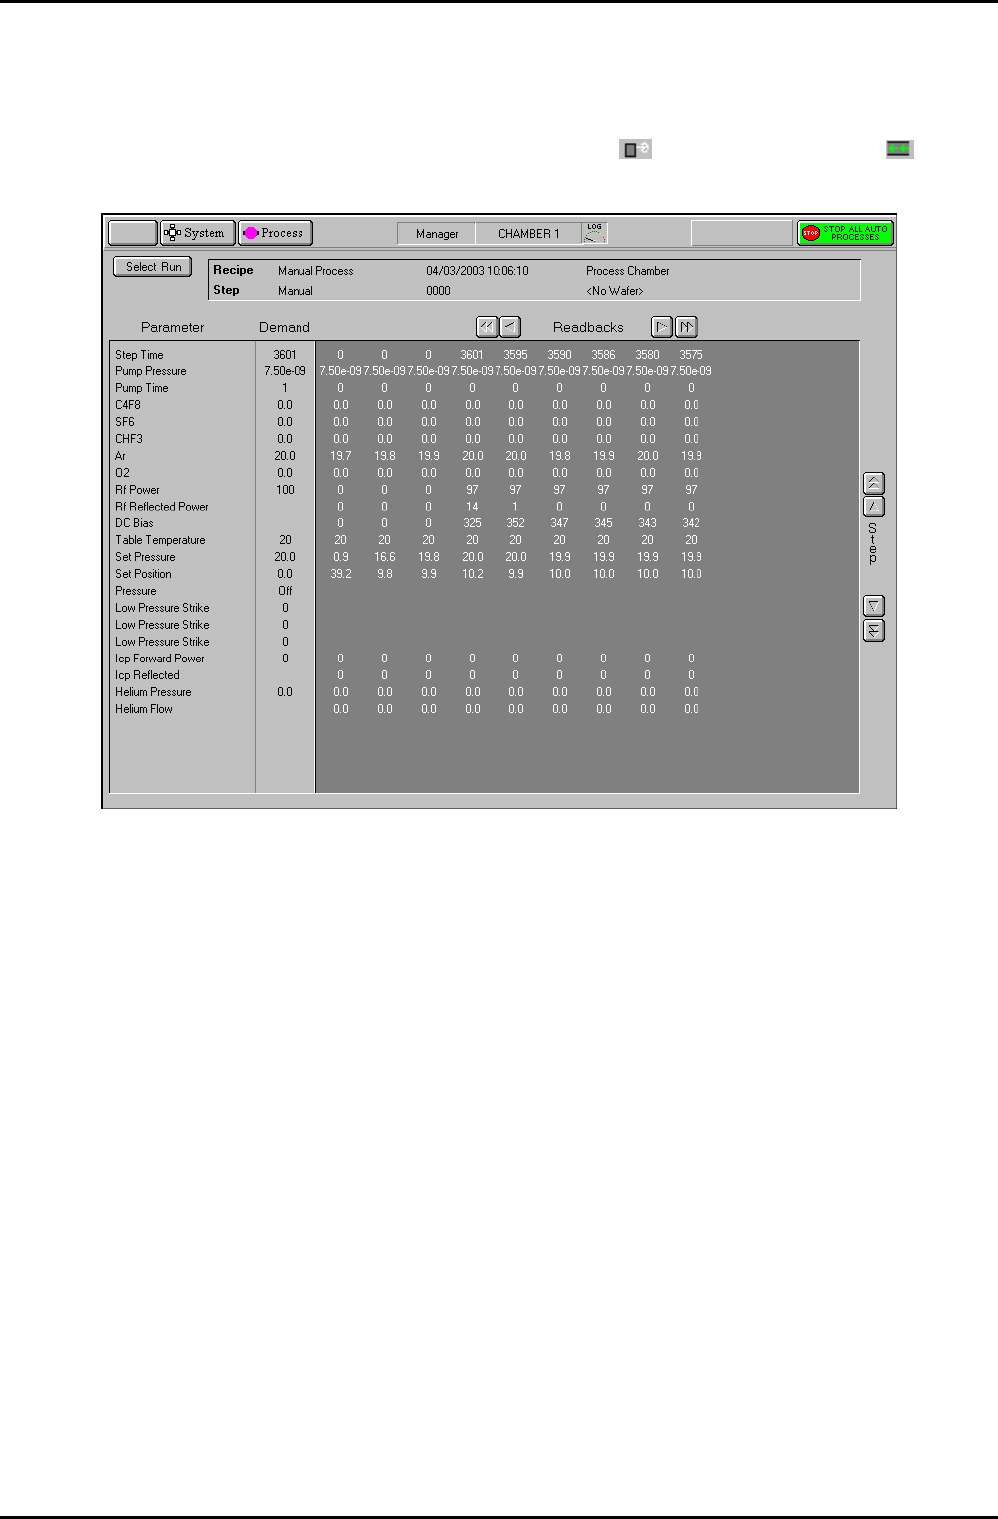
The Run Log page is accessed from the Select Run page by clicking on the View Run button
with any process run other than a leak detection run (
) or MFC calibration run ( )
selected.
Fig 5.6: Run log page
The page displays the Parameters, Demands and Readbacks for the selected log data.
The facilities provided on the page are as follows:
Select Run
button
Displays the Select Log page.
Log information
panel
Displays details about the selected log data.
Parameter list
Lists the logged parameter names
Demand list
Displays the demanded parameter value
Readbacks list
Displays the logged parameter values with respect to time at the log
intervals specified for the process run. The list can be scrolled
horizontally either by single readbacks or by page. The list can also be
scrolled vertically to display further steps (for multi-step recipes).
Operating Instructions
UC Davis 94-721001 Issue 1: March 06 Page 5-28 of 52 Printed: 22-Mar-06, 10:42
System Manual lñÑçêÇ=fåëíêìãÉåíë=mä~ëã~=qÉÅÜåçäçÖó== mä~ëã~ä~ÄpóëíÉãNMM
RKSKP= iÉ~â=ÇÉíÉÅíáçå=~åÇ=jc`=Å~äáÄê~íáçå=äçÖ=é~ÖÉ=
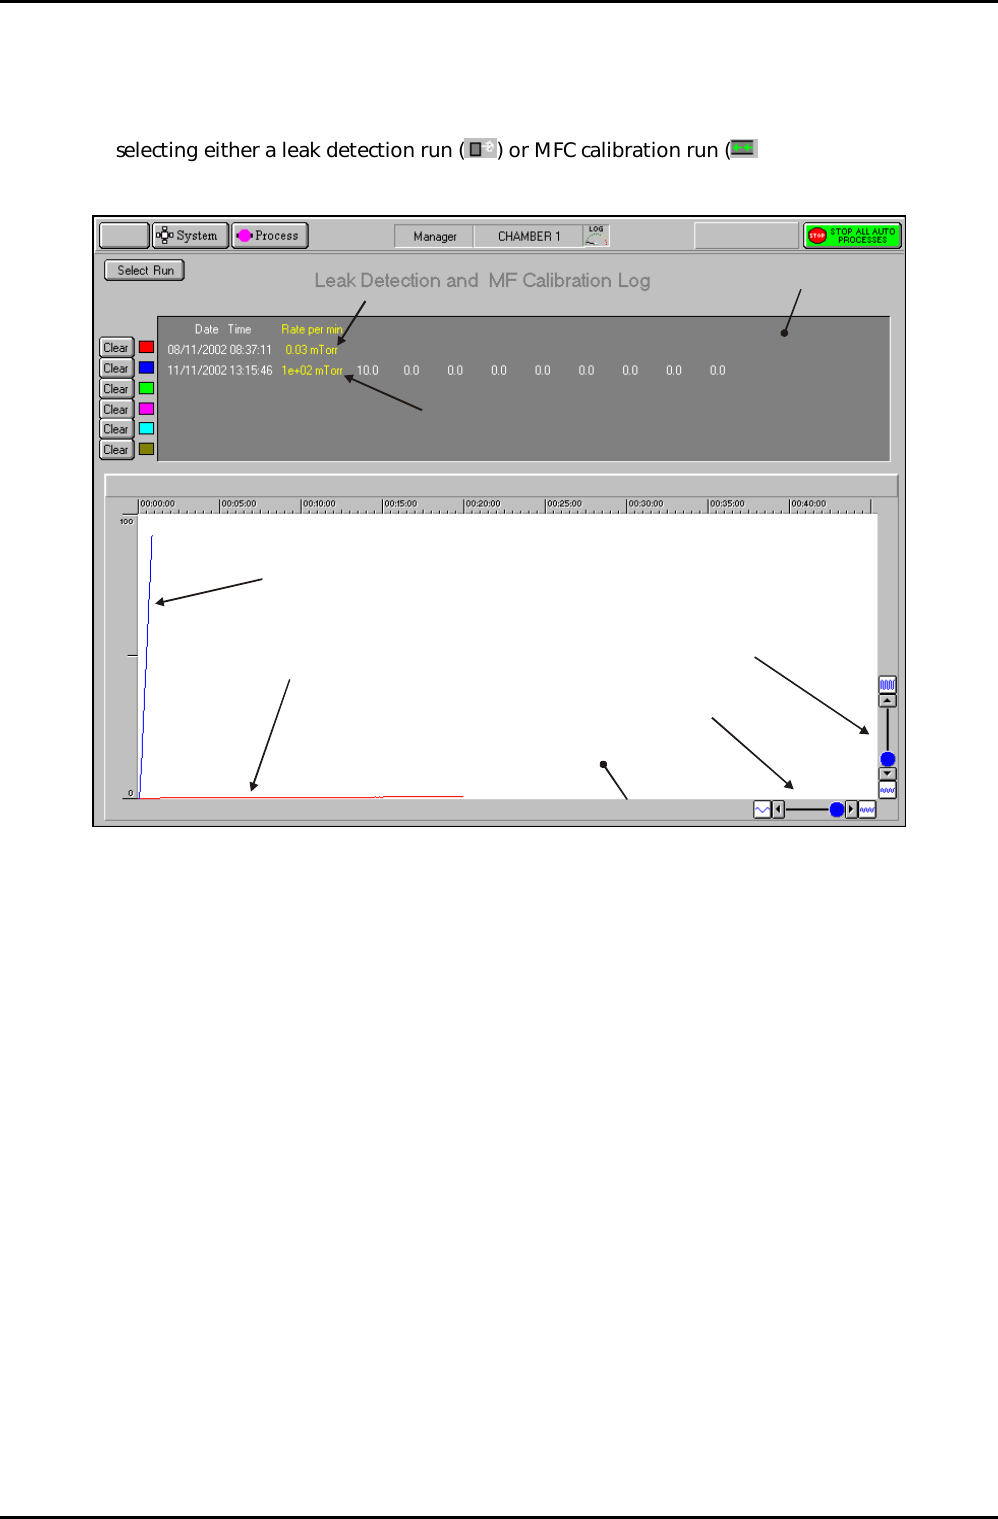
The leak detection and MFC calibration log page is accessed from the Select Run page by
selecting either a leak detection run (
) or MFC calibration run ( ) and then clicking on
the View Run button.
Log panel
Graph panel
Leak detection run
MFC Calibration run
Leak detection trace
(Red)
MFC calibration trace
(Blue)
Time axis scale controls
Pressure axis scale controls
Fig 5.7: Typical leak detection and MFC calibration log page
This page is used to view details of up to six leak check runs and/or MFC calibration runs. Note
that Fig 5.7 shows details of a leak test (red trace) and an MFC calibration run (blue trace).
The facilities available on this page are:
Select Run
button
Displays the Select Run page.
Clear buttons
Select to remove the associated data from the log panel and graph
panel. Note that to re-display the cleared data, you must return to the
Select Run page and re-select it.
Log panel Displays details of each run in text format.
Graph panel Displays a plot of each run (pressure versus time). Each run is
represented by a coloured trace as indicated by the palette displayed
adjacent to the run data in the Log panel. The graph can be scaled in
each axis by the controls located at the bottom-left corner of the
graph.
Operating Instructions
Printed: 22-Mar-06, 10:42 Page 5-29 of 52 UC Davis 94-721001 Issue 1: March 06