IPC-TM-650 EN 2022 试验方法--.pdf - 第200页
The measurement location can then be o bserved on the v ideo camera image and adjusted if necessary. The collimator area indicated on the video image should fit e ntirely within the test area of the sample specimen as se…
5 Procedure
5.1 Instrument Setup
Prior to the purchase of the Certi-
fied Reference Materials (CRMs), confirm with the XRF
manufacturer that the instrument is capable of measuring
phosphorus content and obtain details of the recommended
machine set-up and operational procedures.
Instrument setups usually contain a product file that contains
the required measurement specific hardware and software
settings for the application. In addition, the product file con-
tains a calibration file which defines the calibration settings
and certified reference material to be used.
5.2
Typical Instrument setup conditions and measuring
ranges are as follows:
• Aperture Size: 1 mm for both 10kV and 50kV applications.
• Anode Current (I): I=1 mA for 10kV and I=0.15 mA for 50kV
(Anode current setup maximizing achievable instrument
count rates will yield best instrument repeatability, reference
5.3).
• Primary Beam Filter: NO filter for 10 kV and Ni Filter for
50 kV.
• Measurement Time: 120 s for 10kV and 20 s for 50kV.
5.3 Instrument Calibration
Calibration be per-
formed with CRM’s according to the instrument manufacturer
instructions. The CRM’s
be traceable to national labora-
tories. The structure of the reference material
be similar
to the samples under investigation, i.e., NiP/Cu/PCB, Au/NiP/
Cu/PCB or Au/Pd/NiP/Cu/PCB. Individual calibration foils
be used for multilayer coatings. The certified refer-
ence standards
have compositions and thicknesses
similar to the samples to be measured. If desired, it is possible
to calibrate an instrument over the full (low to high) phospho-
rous range. However, optimum accuracy can be achieved by
calibrating each phosphorous range (low, mid, and high)
separately. Each phosphorous content range should be cali-
brated with no less than 4 standards per range. No less than
3 measurements per calibration standard
be performed.
Calibration checks should be performed after each calibration
and periodically by re-measuring the calibration standards. If
the results are within the measurement uncertainty of the
standards and the uncertainty of the measurement itself, no
action is required. If not, a recalibration of the instrument is
required. Typical CRM standards used and results obtained
are summarized in Table 1.
5.4 Sample Placement
There are some basic rules for
positioning specimens. For each measurement, it
be
ensured that the X-ray fluorescence radiation can reach the
detector without obstruction. For flat, unpopulated PCB
boards, this is not a problem.
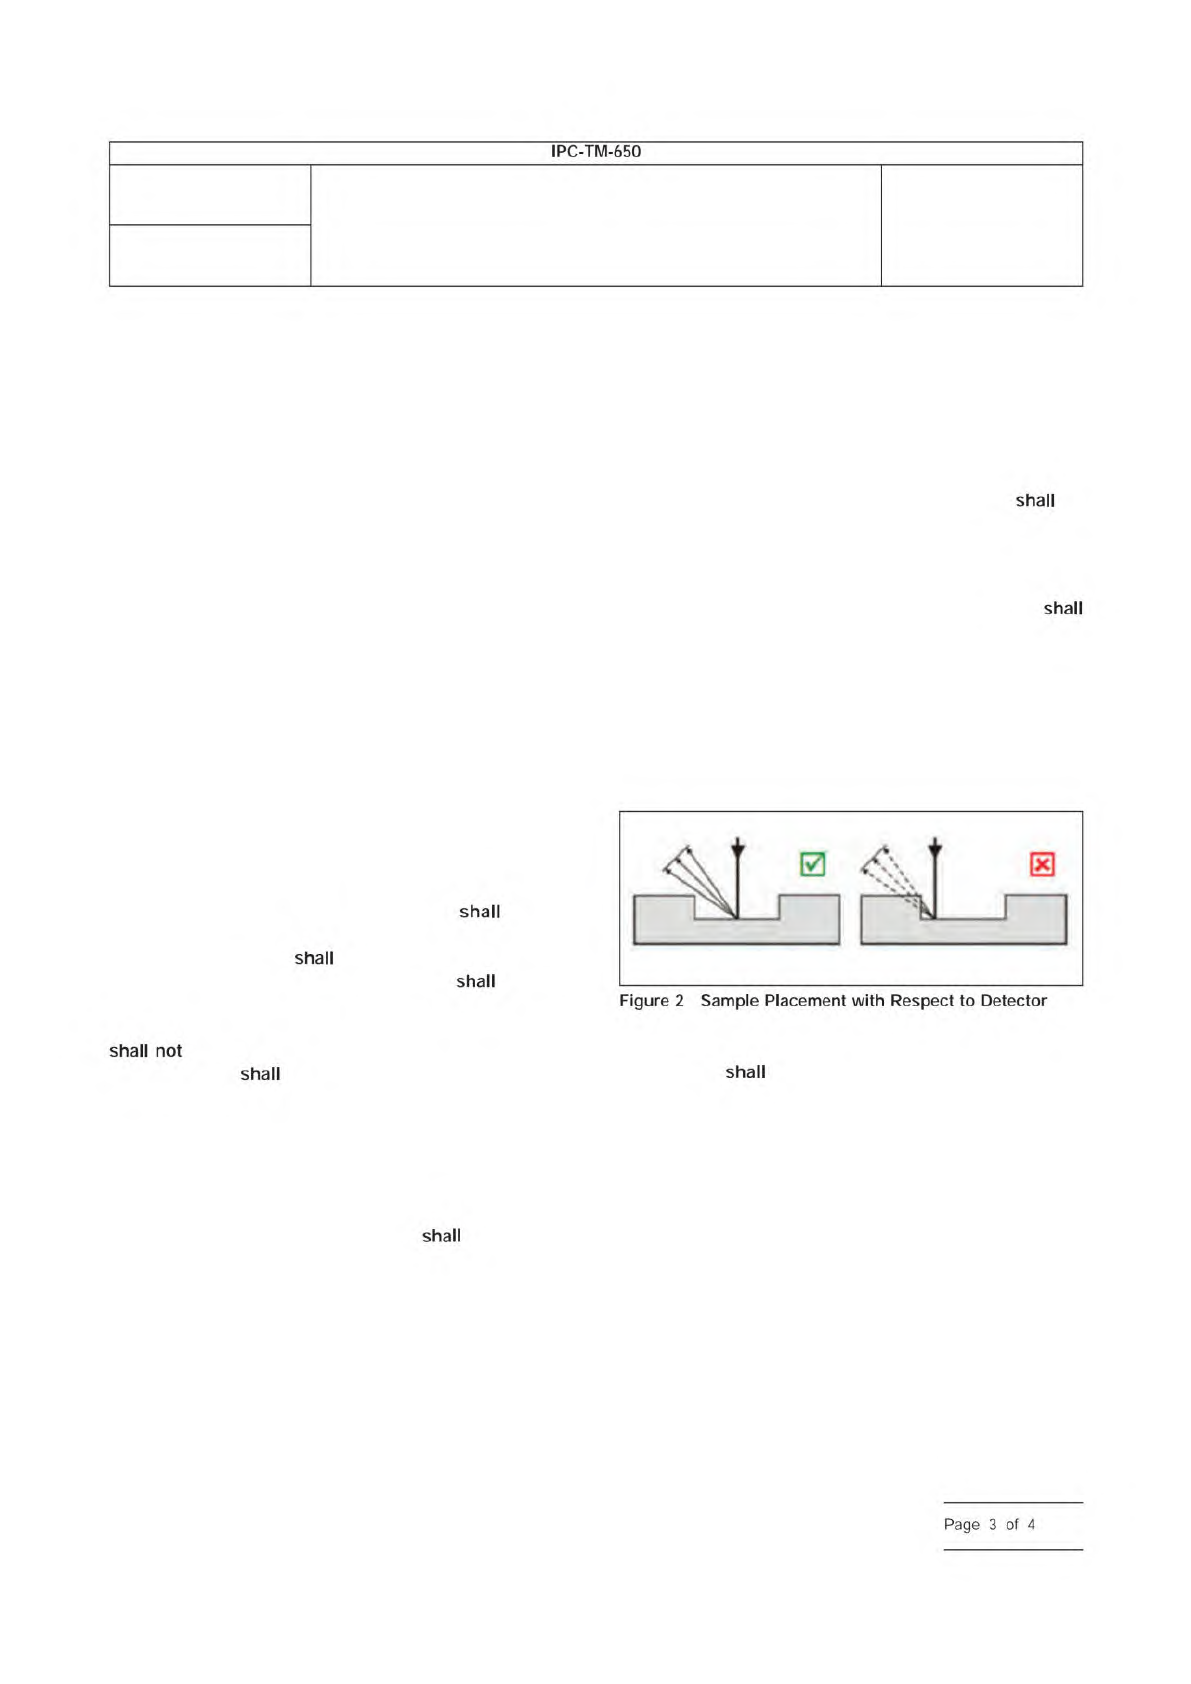
If populated boards are being measured, the operator
note the position of the detector and position the sample such
that no components are present in locations that would
prevent the radiation emanating from the measurement loca-
tion from reaching the detector, as illustrated schematically in
Figure 2.
The area measured should be flat and not tilted.
5.5 Measurement
XRF equipment operation is instrument
specific and
be in accordance with the instrument
manufacturer’s instructions. Always ensure that the correct
measurement file is selected for the application to be mea-
sured. Typically, instruments will slide the measuring stage out
of the instrument when the measurement chamber is opened.
The test sample is then positioned on the programmable X-Y
stage such that the laser pointer points at the measurement
location. When the measurement chamber is closed, the
stage will automatically retract into the chamber.
IPC-2344-2
Number
2.3.44
Subject
Determination of Thickness and Phosphorus Content in
Electroless Nickel (EN) Layers by X-Ray Fluorescence (XRF)
Spectrometry
Date
03/16
Revision
IPC-TM-650
shall
shall
shall
shall
not
shall
shall
Figure
2
Sample
Placement
with
Respect
to
Detector
shall
Page
3
of
4
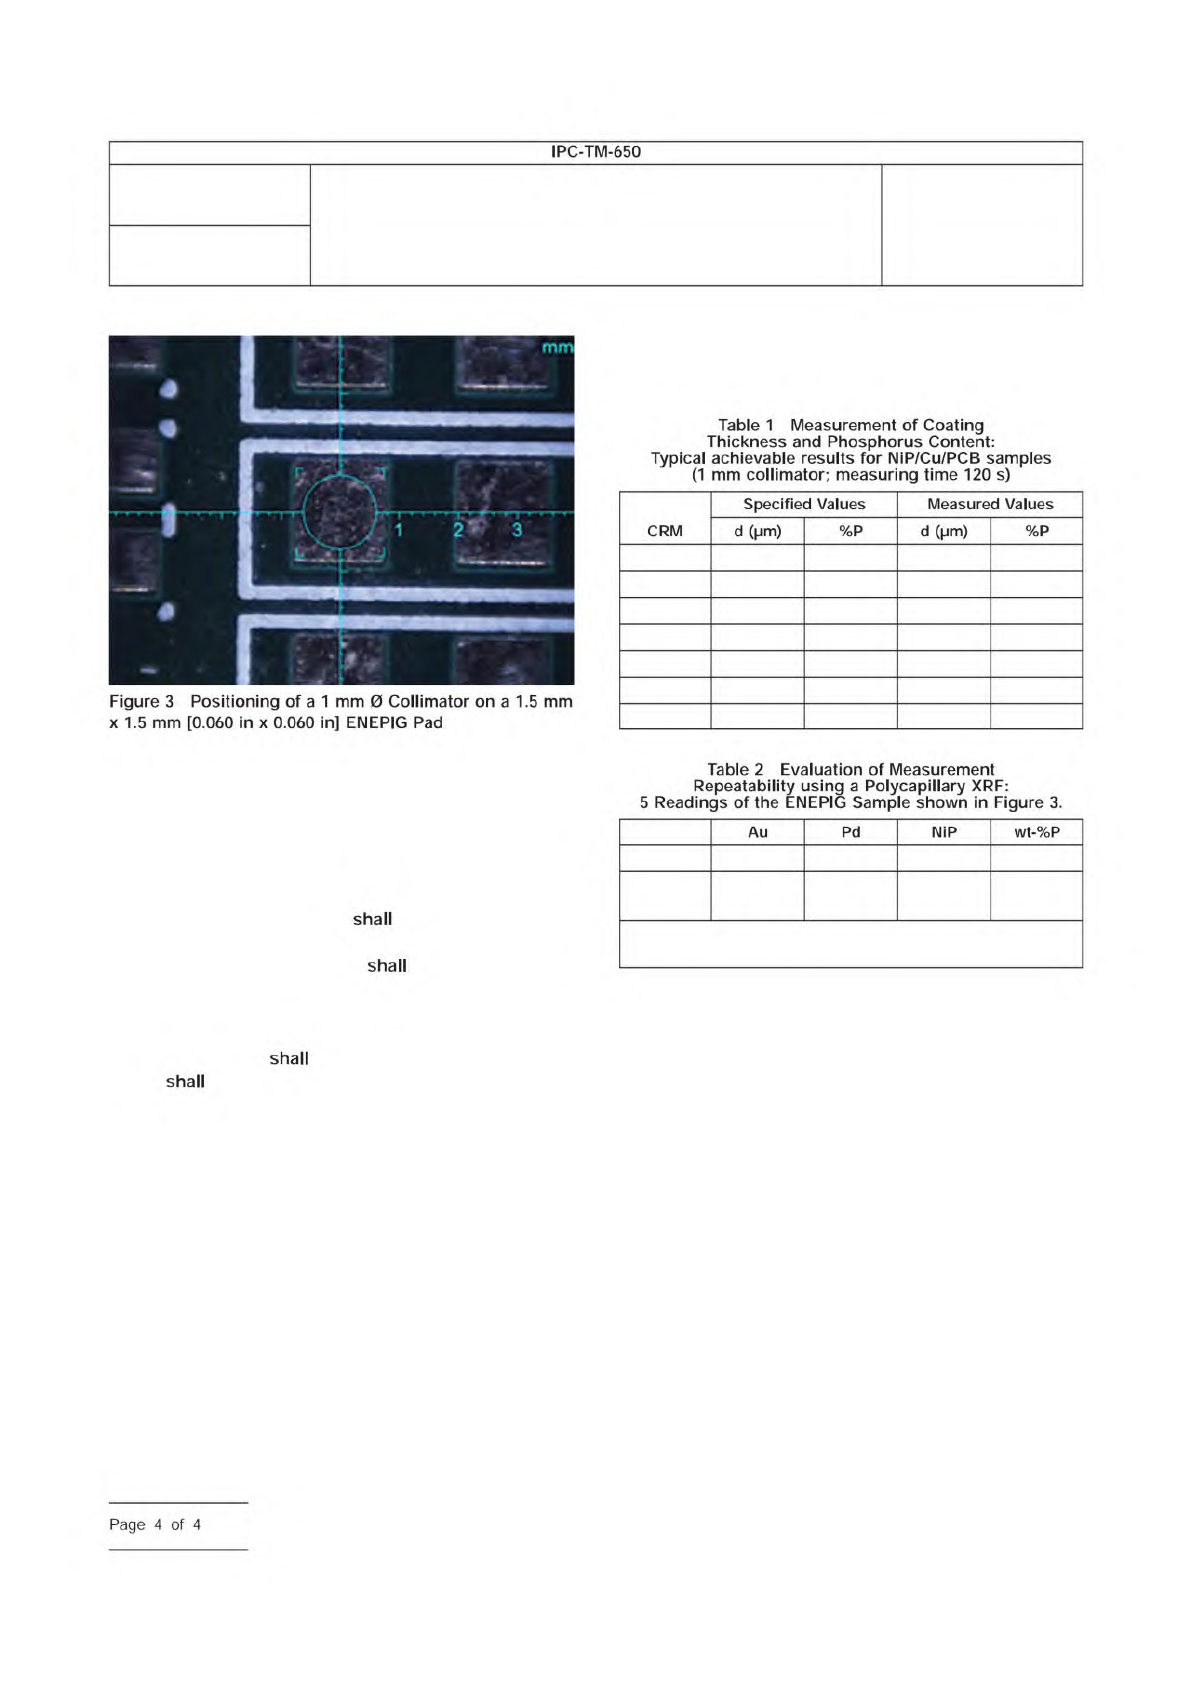
The measurement location can then be observed on the video
camera image and adjusted if necessary. The collimator area
indicated on the video image should fit entirely within the test
area of the sample specimen as seen in Figure 3. The sample
image is then focused with the autofocus feature of the instru-
ment.
A minimum of 5 measurements be made per measure-
ment location (0.060 in x 0.060 in pad). Using a polycapillary
instrument, the 5 measurements
be made at different
locations on the pad or the instrument should be used in a
scanning mode across the pad. On each side of the test
specimen on which an electroless nickel coating has been
applied, three pads
be measured. The Measurement
Report
include as a minimum:
• Instrument used
• Size of the collimator
• Measurement time
• Excitation conditions
• Individual measurement results
• Statistical measurement parameters such as mean, stan-
dard deviation and relative standard deviation
• Specification Limits as required
• Operator, time and date
6 Notes
6.1 Measurement Results:
Table 2 demonstrates the excellent standard deviation
achievable (0.4 wt.-% for 60 s measuring time) for measure-
ment of P-concentration. It should be noted that a high total
spectral intensity of more than 50,000 cps is the result of very
high flux excitation by an instrument using a polycapillary X-ray
optic emitted from a relatively small measuring spot of less
than 50 µm Ø.
In the case of standard aperture beam collimation, the total
measuring time for similar precision is expected to be a factor
of 2-3 X longer.
IPC-2344-2
CRM 1 5.20 (0.1) 0 5.29 (0.1) 0.0 (0.3)
CRM 2 7.35 (0.2) 0 7.43 (0.1) 0.1 (0.3)
CRM 3 1.2 (0.1) 8 (0.4) 1.2 (0.1) 7.7 (0.3)
CRM 6 2.89 (0.1) 10.6 (0.4) 2.88 (0.1) 10.7 (0.4)
CRM 4 6.9 (0.2) 9.0 (0.4) 6.5 (0.1) 8.9 (0.3)
CRM 5 5.90 (0.2) 11.2 (0.4) 5.7 (0.1) 11.1 (0.3)
CRM 7 11.20 (0.2) 11.3 (0.4) 11.2 (0.1) 11.4 (0.3)
Mean 0.049 µm 0.096 µm 3.2 µm 9.3
Standard
deviation
0.002 µm 0.002 µm 0.026 µm 0.413
50 nm Au/96 nm Pd/3.2 µm NiP9.3/Cu/PCB
(Small spot polycapillary instrument, measuring time 60 s)
Number
2.3.44
Subject
Determination of Thickness and Phosphorus Content in
Electroless Nickel (EN) Layers by X-Ray Fluorescence (XRF)
Spectrometry
Date
03/16
Revision
IPC-TM-650
—
Table
1
Measurement
of
Coating
Thickness
and
Phosphorus
Content:
Typical
achievable
results
for
NiP/Cu/PCB
samples
(1
mm
collimator;
measuring
time
120
s)
CRM
Specified
Values
Measured
Values
d
(pm)
%P
d
(pm)
%P
Figure
3
Positioning
of
a
1
mm
0
Collimator
on
a
1.5
mm
x
1.5
mm
[0.060
in
x
0.060
in]
ENEPIG
Pad
shall
shall
Table
2
Evaluation
of
Measurement
Repeatability
using
a
Polycapillary
XRF:
5
Readings
of
the
ENEPIG
Sample
shown
in
Figure
3.
Au
Pd
NiP
wt-%P
shall
shall
Page
4
of
4
Commercial Item Description (CID) A-A-113
Material in this Test Methods Manual was voluntarily established by Technical Committees of IPC. This material is advisory only
and its use or adaptation is entirely voluntary. IPC disclaims all liability of any kind as to the use, application, or adaptation of this
material. Users are also wholly responsible for protecting themselves against all claims or liabilities for patent infringement.
Equipment referenced is for the convenience of the user and does not imply endorsement by IPC.
Page 1 of 1
r
ASSOCIATION
CONNECTING
/
ELECTRONICS
INDUSTRIES
®
221
5
Sanders
Road
Northbrook,
IL
60062-6135
IPC-TM-650
TEST
METHODS
MANUAL
1
Scope
This
test
method
uses
pressure
sensitive
tape
to
determine
the
adhesion
quality
of
platings,
marking
inks
or
paints,
and
other
materials
used
in
conjunction
with
Printed
Boards.
2
Applicable
Documents
Tape,
Pres¬
sure
Sensitive,
Adhesive.
3
Test
Specimens
Any
preproduction,
first
article,
or
pro¬
duction
printed
board.
A
minimum
of
three
tests
should
be
performed
for
each
evaluation.
4
Apparatus
or
Material
4.1
Tape
A
roll
of
pressure
sensitive
tape
3M
Brand
600
1/2
inch
wide
or
a
tape
as
described
in
(CID
AA-1
1
3),
Type
1
,
Class
B,
except
that
the
tape
may
be
clear.
The
shelf
life
of
the
tape
is
one
year.
5
Procedure
5.1
Test
Press
a
strip
of
pressure
sensitive
tape,
50
mm
[2.0
in]
minimum
in
length,
firmly
across
the
surface
of
the
test
Number
2.4.1
Subject
Adhesion,
Tape
Testing
Date
Revision
05/04
E
Originating
Task
Group
Rigid
Printed
Board
Performance
Task
Group
(D-33a)
area
removing
all
air
entrapment.
The
time
between
applica¬
tion
and
removal
of
tape
shall
be
less
than
one
minute.
Remove
the
tape
by
a
rapid
pull
force
applied
approximately
perpendicular
(right
angle)
to
the
test
area.
An
unused
strip
of
tape
must
be
used
for
each
test.
5.2
Evaluation
Visually
examine
tape
and
test
area
for
evi¬
dence
of
any
portion
of
the
material
tested
having
been
removed
from
the
specimen.
5.3
Report
The
report
should
note
any
evidence
of
material
removed
by
this
test.
6
Notes
6.1
If
plating
overhang
breaks
off
(slivers)
and
adheres
to
the
tape,
it
is
evidence
of
overhang
but
not
an
adhesion
failure.
6.2
If
foreign
material
(oil,
grease,
etc.)
is
present
on
the
test
surface
the
results
may
be
affected.
6.3
Certification
of
3M
Brand
600
1/2
inch
tape
to
CID-A-A-
1
13
is
not
required.
The
3M
Brand
600
1/2
inch
tape
is
avail¬
able
through
most
office
supply
stores.