IPC-TM-650 EN 2022 试验方法--.pdf - 第406页
Number 2.4.53 Subject Dye and Pull Test Method (Formerly Known as Dye and Pry) Date 8/2017 Revision Page 5 of 1 1 IPC-TM-650 Figure 7 Dye Vacuum Station - Sample Completely Submerged in Dye Figure 8 Sample Being Removed …
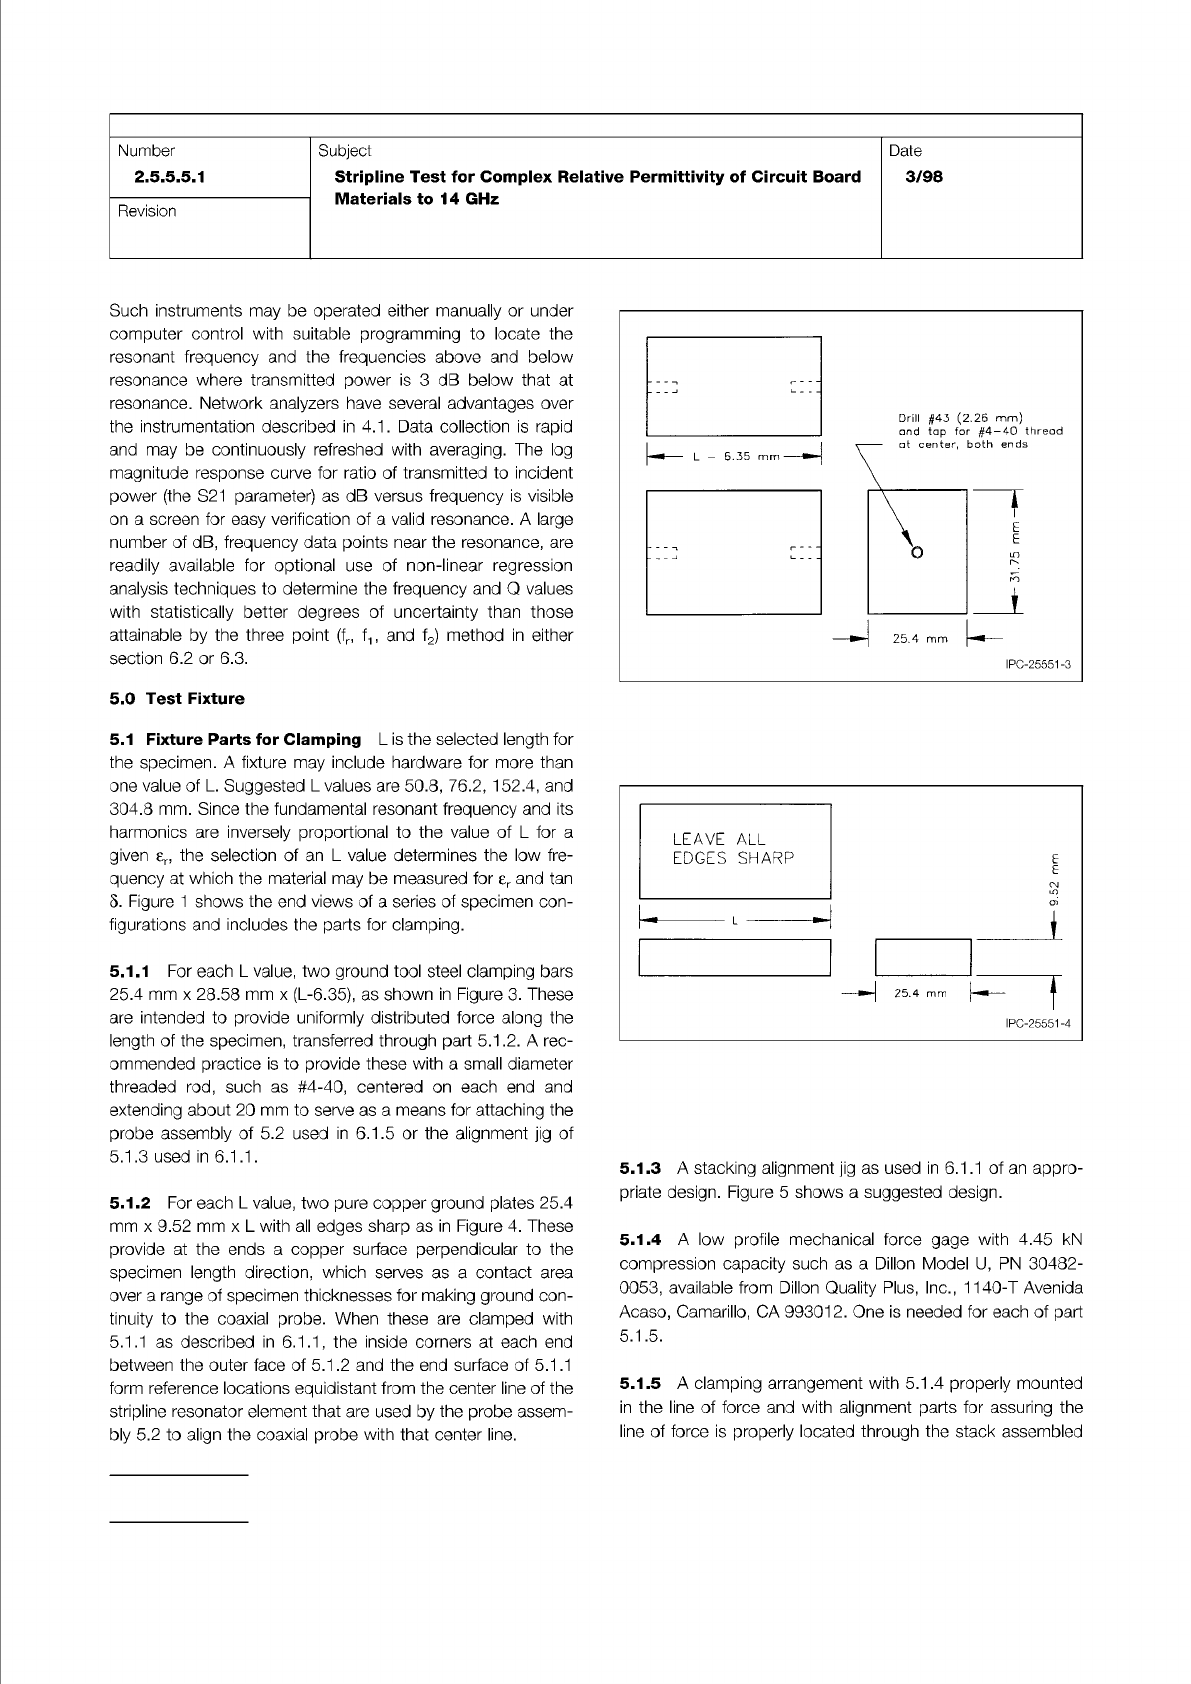
Figure 3 Three View Drawing of a Steel Clamping Bar
(See 5.1.1) Cut to Length for the 50.8 mm L Value
(Extended #4-40 Threaded Rod Both Ends is Not Shown)
Figure 4 Three View Drawing of a Copper Ground Plate
(See 5.1.2) for the 50.8 mm L Value
IPC-TM-650
Page 4 of 11
Number
2.5.5.5.1
Revision
Subject
Stripline
Test
for
Complex
Relative
Permittivity
of
Circuit
Board
Materials
to
14
GHz
Date
3/98
Such
instruments
may
be
operated
either
manually
or
under
computer
control
with
suitable
programming
to
locate
the
resonant
frequency
and
the
frequencies
above
and
below
resonance
where
transmitted
power
is
3
dB
below
that
at
resonance.
Network
analyzers
have
several
advantages
over
the
instrumentation
described
in
4.1.
Data
collection
is
rapid
and
may
be
continuously
refreshed
with
averaging.
The
log
magnitude
response
curve
for
ratio
of
transmitted
to
incident
power
(the
S21
parameter)
as
dB
versus
frequency
is
visible
on
a
screen
for
easy
verification
of
a
valid
resonance.
A
large
number
of
dB,
frequency
data
points
near
the
resonance,
are
readily
available
for
optional
use
of
non-linear
regression
analysis
techniques
to
determine
the
frequency
and
Q
values
with
statistically
better
degrees
of
uncertainty
than
those
attainable
by
the
three
point
(fr,
and
f2)
method
in
either
section
6.2
or
6.3.
5.0
Test
Fixture
5.1
Fixture
Parts
for
Clamping
L
is
the
selected
length
for
the
specimen.
A
fixture
may
include
hardware
for
more
than
one
value
of
L.
Suggested
L
values
are
50.8,
76.2,
152.4,
and
304.8
mm.
Since
the
fundamental
resonant
frequency
and
its
harmonics
are
inversely
proportional
to
the
value
of
L
for
a
given
£r,
the
selection
of
an
L
value
determines
the
low
fre¬
quency
at
which
the
material
may
be
measured
for
and
tan
8.
Figure
1
shows
the
end
views
of
a
series
of
specimen
con¬
figurations
and
includes
the
parts
for
clamping.
5.1.1
For
each
L
value,
two
ground
tool
steel
clamping
bars
25.4
mm
x
28.58
mm
x
(L-6.35),
as
shown
in
Figure
3.
These
are
intended
to
provide
uniformly
distributed
force
along
the
length
of
the
specimen,
transferred
through
part
5.1
.2.
A
rec¬
ommended
practice
is
to
provide
these
with
a
small
diameter
threaded
rod,
such
as
#4-40,
centered
on
each
end
and
extending
about
20
mm
to
serve
as
a
means
for
attaching
the
probe
assembly
of
5.2
used
in
6.1.5
or
the
alignment
jig
of
5.1
.3
used
in
6.1
.1
.
5.1.2
For
each
L
value,
two
pure
copper
ground
plates
25.4
mm
x
9.52
mm
x
L
with
all
edges
sharp
as
in
Figure
4.
These
provide
at
the
ends
a
copper
surface
perpendicular
to
the
specimen
length
direction,
which
serves
as
a
contact
area
over
a
range
of
specimen
thicknesses
for
making
ground
con¬
tinuity
to
the
coaxial
probe.
When
these
are
clamped
with
5.1
.1
as
described
in
6.1
.1
,
the
inside
corners
at
each
end
between
the
outer
face
of
5.1
.2
and
the
end
surface
of
5.1
.1
form
reference
locations
equidistant
from
the
center
line
of
the
stripline
resonator
element
that
are
used
by
the
probe
assem¬
bly
5.2
to
align
the
coaxial
probe
with
that
center
line.
IPC-25551-3
Drill
#43
(2.26
mm)
L
—
6.35
mm
L
LEAVE
ALL
EDGES
SHARP
5.1.3
A
stacking
alignment
jig
as
used
in
6.1
.1
of
an
appro¬
priate
design.
Figure
5
shows
a
suggested
design.
5.1.4
A
low
profile
mechanical
force
gage
with
4.45
kN
compression
capacity
such
as
a
Dillon
Model
U,
PN
30482-
0053,
available
from
Dillon
Quality
Plus,
Inc.,
11
40-T
Avenida
Acaso,
Camarillo,
GA
993012.
One
is
needed
for
each
of
part
5.1.5.
5.1.5
A
clamping
arrangement
with
5.1.4
properly
mounted
in
the
line
of
force
and
with
alignment
parts
for
assuring
the
line
of
force
is
properly
located
through
the
stack
assembled
Number
2.4.53
Subject
Dye and Pull Test Method (Formerly Known as Dye and Pry)
Date
8/2017
Revision
Page 5 of 11
IPC-TM-650
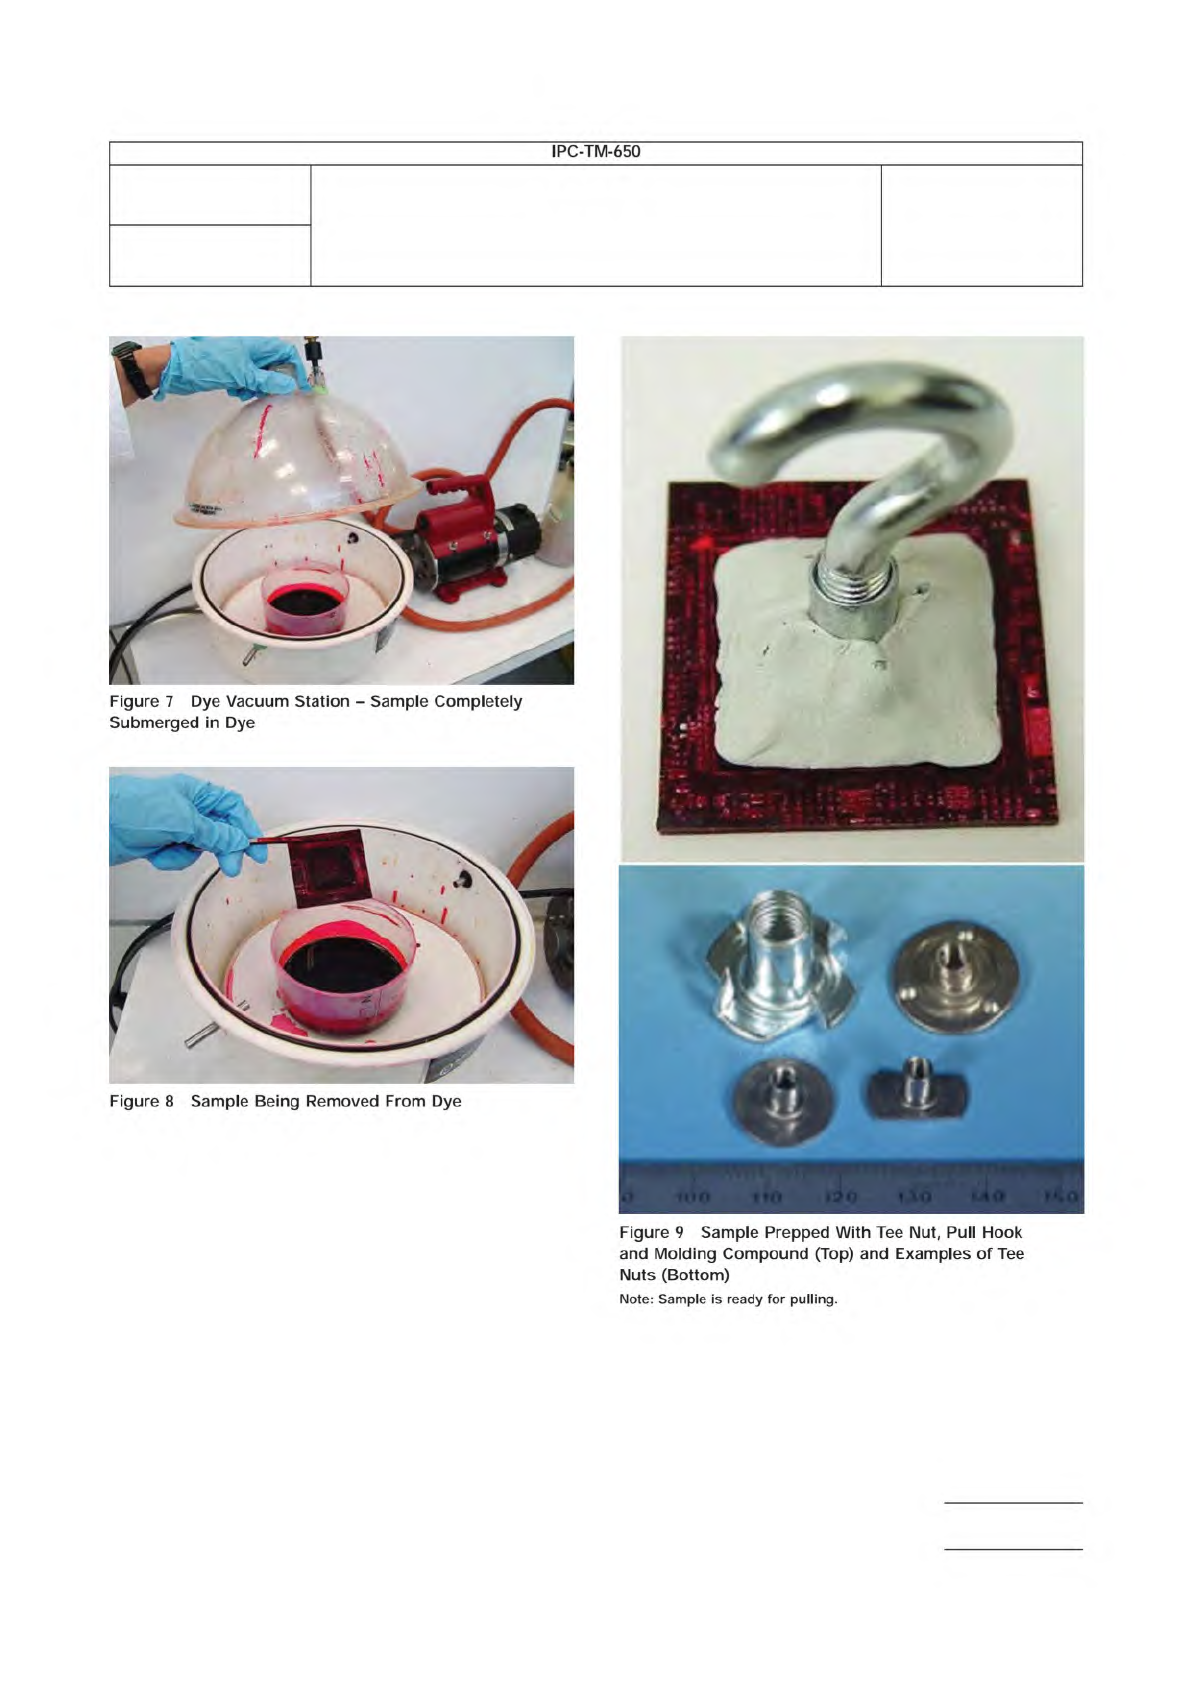
Figure
7
Dye
Vacuum
Station
-
Sample
Completely
Submerged
in
Dye
Figure
8
Sample
Being
Removed
From
Dye
Figure
9
Sample
Prepped
With
Tee
Nut,
Pull
Hook
and
Molding
Compound
(Top)
and
Examples
of
Tee
Nuts
(Bottom)
Note:
Sample
is
ready
for
pulling.
Number
2.4.53
Subject
Dye and Pull Test Method (Formerly Known as Dye and Pry)
Date
8/2017
Revision
Page 6 of 11
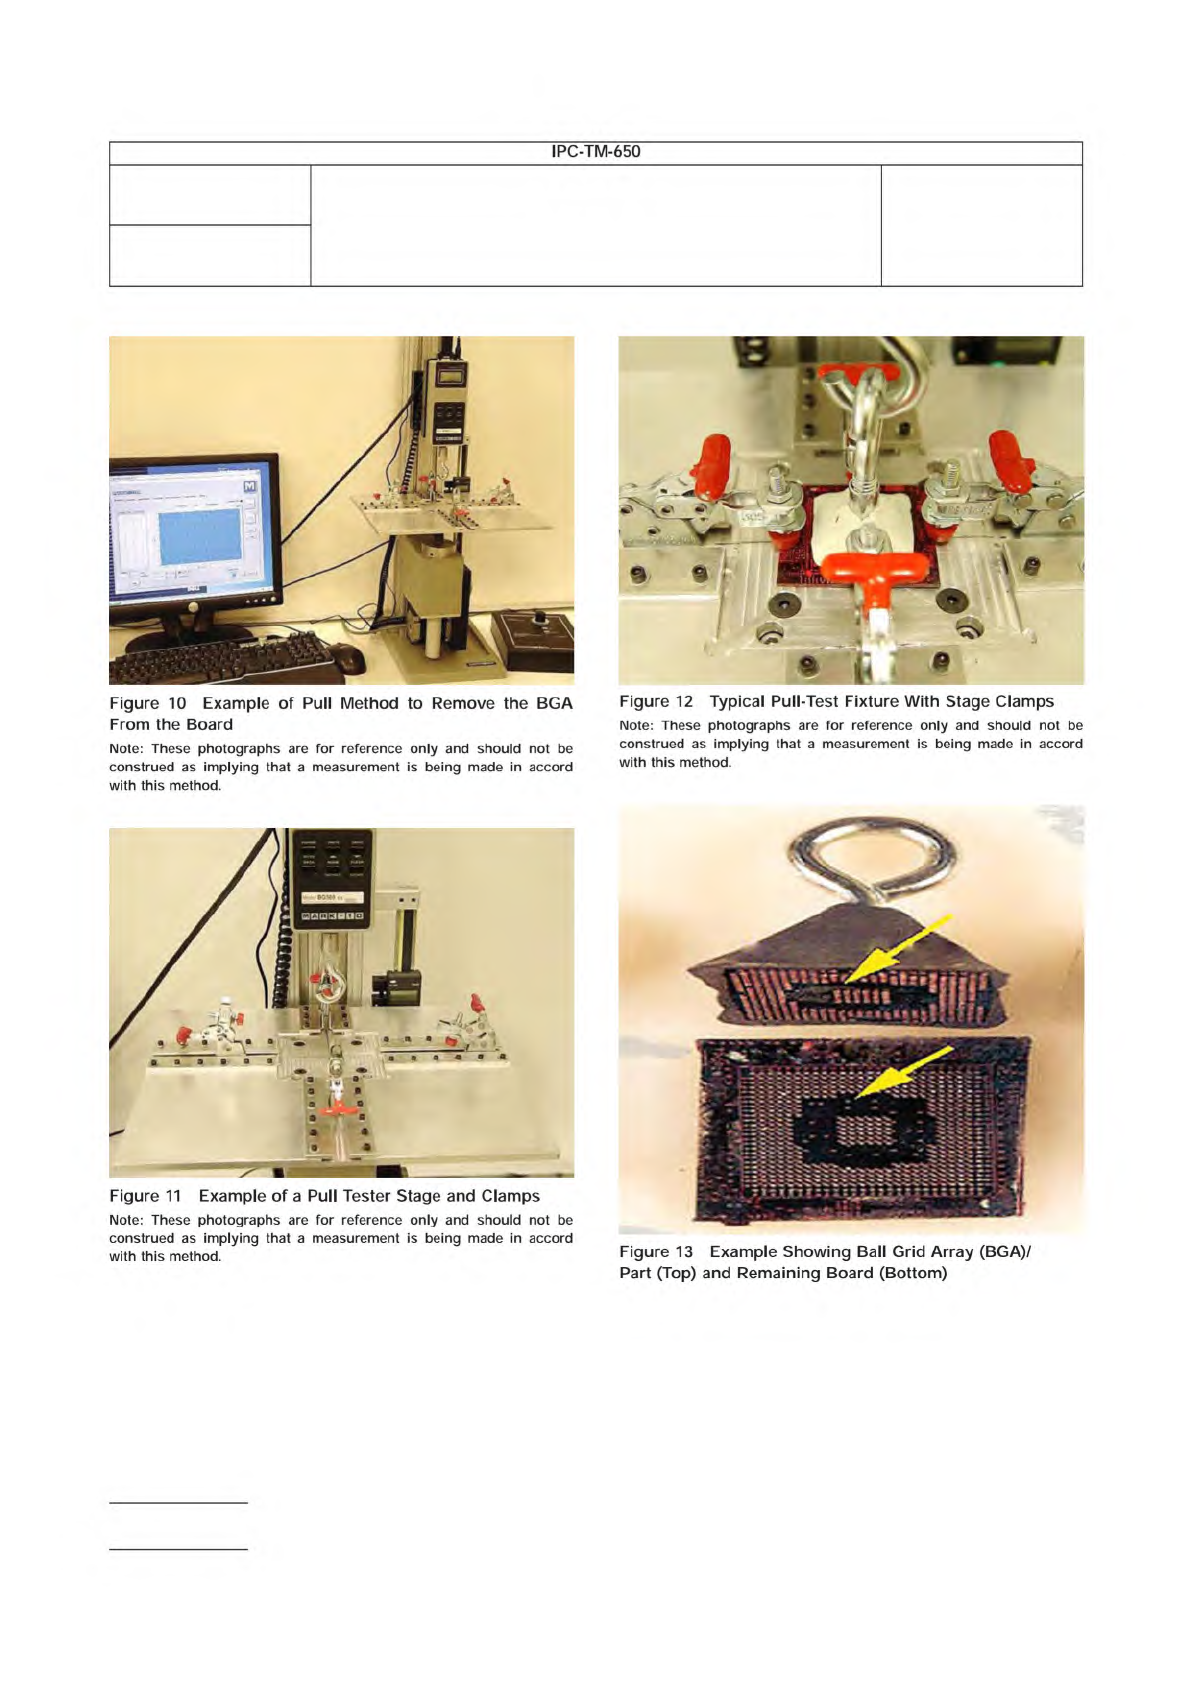
Figure
11
Example
of
a
Pull
Tester
Stage
and
Clamps
Note:
These
photographs
are
for
reference
only
and
should
not
be
construed
as
implying
that
a
measurement
is
being
made
in
accord
with
this
method.
Figure
13
Example
Showing
Ball
Grid
Array
(BGA)/
Part
(Top)
and
Remaining
Board
(Bottom)
Figure
10
Example
of
Pull
Method
to
Remove
the
BGA
From
the
Board
Note:
These
photographs
are
for
reference
only
and
should
not
be
construed
as
implying
that
a
measurement
is
being
made
in
accord
with
this
method.
Figure
12
Typical
Pull-Test
Fixture
With
Stage
Clamps
Note:
These
photographs
are
for
reference
only
and
should
not
be
construed
as
implying
that
a
measurement
is
being
made
in
accord
with
this
method.
IPC-TM-650
—
7
*
»
M
m
.
B
-
f
Jj
>
>
•••
------
c
m