IPC-TM-650 EN 2022 试验方法--.pdf - 第766页
1 Scope and Purpose 1.1 Sco pe This method is intended to si mulate exposure to the thermal co nditions by convection ref low a ssembly. 1.2 Pur pose This method be used to replicate the thermodynamic effects by as sembl…
7. When the thermocouple/ thermometer measures 150 °C,
record the resistance of the Sense net with a 4-wire cable
and a bench top multi-meter.
8. For validation, compare the resistance readings of the
manual measurements in the oven and the test machine
for each coupon.
6.5.1.2 Test Temperature/Resistance Validation
1. Verify the equipment is calibrated and ready for use.
2. Load coupons into all test heads on the test machine.
3. Enter the test parameters shown in Table 6-3 (or equiva-
lent) into the test machine.
4. For Cycle 2, measure the resistance at 150 °C and at room
temperature on the test machine.
5. For validation, compare the resistance measurement at
150 °C between test machines and at room temperature
between test machines.
6.5.2 Method B
6.5.2.1 Temperature Coefficient of Resistance (TCR)
Validation
1. Label coupons and record 4-wire resistance with bench
top multi-meter.
2. Measure the temperature and resistance at the following
equilibrium temperatures: 23, 75, 125, 150, 175, 200, and
220 °C. Calculate TCR for test temperature 23-220 °C.
3. For validation, compare the measured TCR values
between test machines.
6.5.2.2 Test Temperature/Resistance Validation
1. Run 3 cycles for test temperature 23-220 °C using the
mean TCR measured in 6.5.2.1.
2. For Cycle 3, record the calculated temperature T(calc,
high) at end of high temperature dwell.
3. For validation, compare the T(calc, high) value between
test machines.
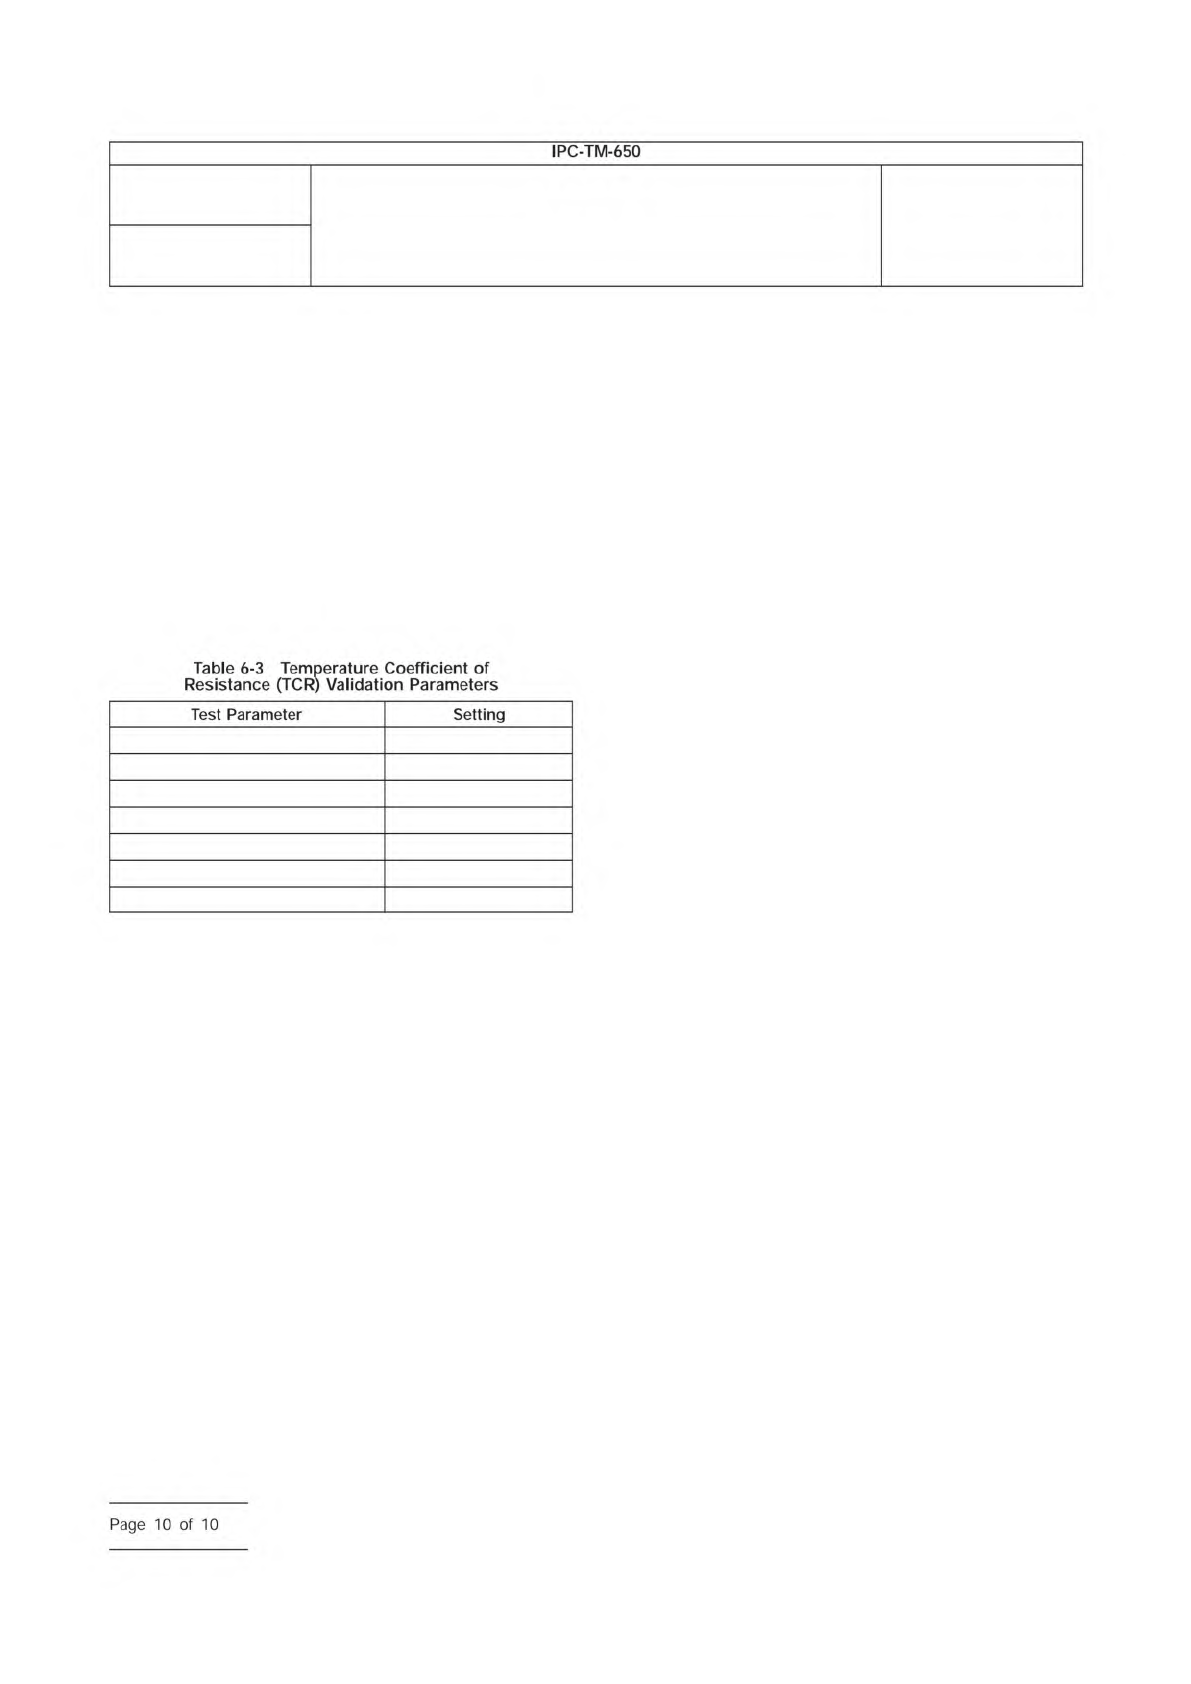
Maximum # Cycles 5
Data Recorded 1
Test Temperature 150 °C
% Rejection Sense Circuit 10%
% Rejection Power Circuit 10%
Precycle Time 5
Compensation Calculated
Number
2.6.26
Subject
DC Current Induced Thermal Cycling Test
Date
5/14
Revision
A
IPC-TM-650
Table
6-3
Temperature
Coefficient
of
Resistance
(TCR)
Validation
Parameters
Test
Parameter
Setting
Page
10
of
10
1 Scope and Purpose
1.1 Scope
This method is intended to simulate exposure to
the thermal conditions by convection reflow assembly.
1.2 Purpose
This method be used to replicate the
thermodynamic effects by assembly on the test specimen.
The use of this method is intended to simulate those effects
that are the result of soldering thermal excursions.
1.2.1
This method be used for qualification testing of
an applicable test specimen. The evaluation of acceptability
for qualification
be in accordance with the requirements
defined in 5.3.
1.2.2
This method may be used for lot acceptance. The
evaluation for lot acceptability should be in accordance with
the requirements defined in 5.3 or as agreed upon between
user and supplier (AABUS).
2 Applicable Documents
Terms and Definitions
Generic Standard on Printed Board Design
Acceptability of Printed Boards
Printed Board Handling and Storage Guidelines
Qualification and Performance Specification for
Rigid Printed Boards
Qualification and Performance Specification for
Flexible Printed Boards
Qualification and Performance Specification for
High Frequency (Microwave) Printed Boards
Guidelines for Microsection Preparation
User’s Guide for IPC-TM-650, Method 2.6.27
Test Methods Manual
1
2.1.1 Microsectioning – Microsectioning, Manual and Semi
or Automatic Method
3 Test Specimen
3.1 Design/Construction Criteria
3.1.1
The test specimen be the A/B, AB-R, and/or the
D coupon as designed in accordance with the requirements of
IPC-2221 Appendix A or B. Use of alternate specimens
be AABUS.
3.1.2
The test specimen(s) be constructed with holes
contained in the printed board it represents as follows:
a. A/B, A/B-R and D coupons
be constructed with
both the largest plated through-holes (PTHs) and the
smallest vias.
b. Propagated B and D coupons
be constructed with
the intended via structure. (Multiple B and D coupons are
used for designs with multiple structures.)
3.1.2.1
The test specimen(s) contain the representa-
tive ground and power planes of the printed board design.
3.1.2.2
The test specimen(s) contain the representa-
tive filled through vias, applicable blind and/or buried vias,
including microvias, of the printed board design.
3.1.3
The test specimen(s) allow for microsection
evaluation of all the applicable, representative PTHs and vias
defined in 3.1.2 after exposure to the conditions of this Test
Method.
Special tooling may be required for potting an entire
‘‘D’’ Coupon for microsection examination.
3.1.4
Deviations to the test specimen design/construction
or use of an alternate test specimen such as the printed board
or a section of the printed board
be AABUS.
4 Apparatus
4.1 Drying Oven
4.1.1
The oven be capable of maintaining a uniform
set temperature within the 105 to 125 °C [221 to 257 °F]
range.
1. Current and revised IPC Test Methods are available on the IPC Web site (www.ipc.org/test-methods.aspx).
3000 Lakeside Drive, Suite 105N
Bannockburn, IL 60015-1249
IPC-TM-650
TEST METHODS MANUAL
Number
2.6.27
Subject
Thermal Stress, Convection Reflow Assembly
Simulation
Date
2/2020
Revision
B
Originating Task Group
Thermal Stress Test Methodology Subcommittee
(D-32)
Association
Connecting
Electronics
Industries
shall
shall
shall
shall
shall
shall
shall
shall
IPC-T-50
IPC-2221
IPC-A-600
IPC-1601
IPC-6012
IPC-6013
IPC-6018
IPC-9241
IPC-9631
IPC-TM-650
Note:
shall
shall
shall
shall
shall
Material
/n
this
Test
Methods
Manual
was
voluntarily
established
by
Technical
Committees
of
I
PC.
This
material
/s
advisory
only
and
"s
use
or
adaptation
,
s
entirely
voluntary.
IPC
disclaims
all
liability
of
any
kind
as
to
the
use,
application,
or
adaptation
of
this
material.
Users
are
also
wholly
responsible
for
protecting
themselves
against
all
claims
or
liabilities
for
patent
infringement.
Equipment
referenced
/s
for
the
convenience
of
the
user
and
does
not
imply
endorsement
by
IPC.
Page
1
of
10

4.2 Convection Reflow Oven or Simulator
4.2.1
The system used to simulate the thermodynamic
effects of assembly
be convection reflow.
4.2.1.1
The system have adequate environmental
controls to maintain the tolerance range and limits in accor-
dance with the reflow profile depicted in either Figure 5-1,
Figure 5-2 or Figure 5-3.
4.2.1.2
The system should accommodate verifiable calibra-
tion compliance and reflow profile generation. See note 6.1 for
additional considerations.
4.2.1.3
The test specimen be handled and stored in a
controlled environment to minimize moisture ingression. See
IPC-1601 for details on the proper handling and storage of
test specimens.
4.2.2
Deviations to the equipment requirements and
acceptability of the alternative methods
be AABUS.
4.3 Microscope
4.3.1
The magnification used for defect recognition must be
in agreement with the inspection requirements/capabilities
defined in the applicable performance specification (e.g., IPC-
6012, IPC-6013, IPC-6018, etc.) and IPC-A-600.
4.4 Resistance Measurements of IPC-2221 Appendix A,
D Coupons
4.4.1
When specified by performance specification or pro-
curement documentation, resistance measurements of the
IPC-2221B Appendix A, D coupons
be required.
4.4.2
The resistance measurement have enough pre-
cision to clearly determine the resistance percent change as
required by the user for the resistance level of each sample’s
nets.
4.4.3
The total system uncertainty from resistance, tem-
perature and time/cycle variations
be less than 10% of
the failure criteria required by the user. For example, if the
required failure criteria is 5% then the total system uncertainty
be no greater than 0.50%.
4.4.4
The resistance data consist of at least 1 reading
per sample net every second during the entire reflow cycle.
5 Procedure
5.1 Conditioning
5.1.1 The test specimen be conditioned by drying in an
oven to remove moisture for a minimum of six (6) hours at 105 to
125 °C [221 to 257 °F].
5.1.2
Test specimens that are thicker or more complex may
require longer baking times to achieve acceptable moisture
levels. Record the bake times and temperature if different than
those stated in 5.1.1. See IPC-1601 for additional guidance
on baking to achieve acceptable moisture levels. See note
6.2.
5.1.3
Deviations to the conditioning requirements in 5.1.1
such as when used for acceptance criteria and/or any
changes to the time and temperature
be AABUS. See
6.3.
5.2 Reflow Profile
5.2.1
Reflow the test specimen in accordance with Table
5-1 (default), Table 5-2 (low temperature profile) or Table 5-3.
5.2.2
The reflow profile be in accordance with either
Figure 5-1, Figure 5-2 or Figure 5-3. Figure 5-1 represents the
default reflow profile. Figure 5-2 represents the low tempera-
ture profile. Figure 5-3 represents a 245 °C reflow profile. The
times to t1, t2 and t3 may vary based on the mass of the
sample test specimen. To avoid over stressing of samples,
times should be shortened for low mass samples. Times
should be extended for high mass samples, such that the
zone (air) temperature
be more than 25 °C above
the target surface temperature at any point in the cycle.
The attachment of thermocouples to the sample test speci-
men
be such that the reflow profile is calibrated to the
surface temperature of the test specimen.
5.2.3
The test specimen be subjected to a minimum
of six (6) reflow cycles.
5.2.4
The cool down rate be in accordance with Table
5-1, Table 5-2 or Table 5-3, based on the reflow profile
selected in 5.2.1. The cool down is complete when the test
specimen reaches 45 °C. The test specimen
achieve a
thermal equilibrium of 45 °C or less prior to starting the next
reflow cycle. If the time it takes to achieve thermal equilibrium
cannot be determined, then a five (5) minute dwell between
reflow cycles
be required.
5.2.5
Deviations to the reflow profile or number of cycles
be AABUS.
Number
2.6.27
Subject
Thermal Stress, Convection Reflow Assembly Simulation
Date
2/2020
Revision
B
IPC-TM-650
shall
shall
shall
shall
shall
shall
shall
not
shall
shall
shall
shall
shall
shall
shall
shall
shall
shall
shall
Page
2
of
10