IPC-TM-650 EN 2022 试验方法--.pdf - 第28页
Intermediate Calculations Because macros were avo ided, the messy details of the calculations appear in the next section. If t hey make on e nervous, just hide t hem, and go directly to the Sc orecard. One ma y , however…
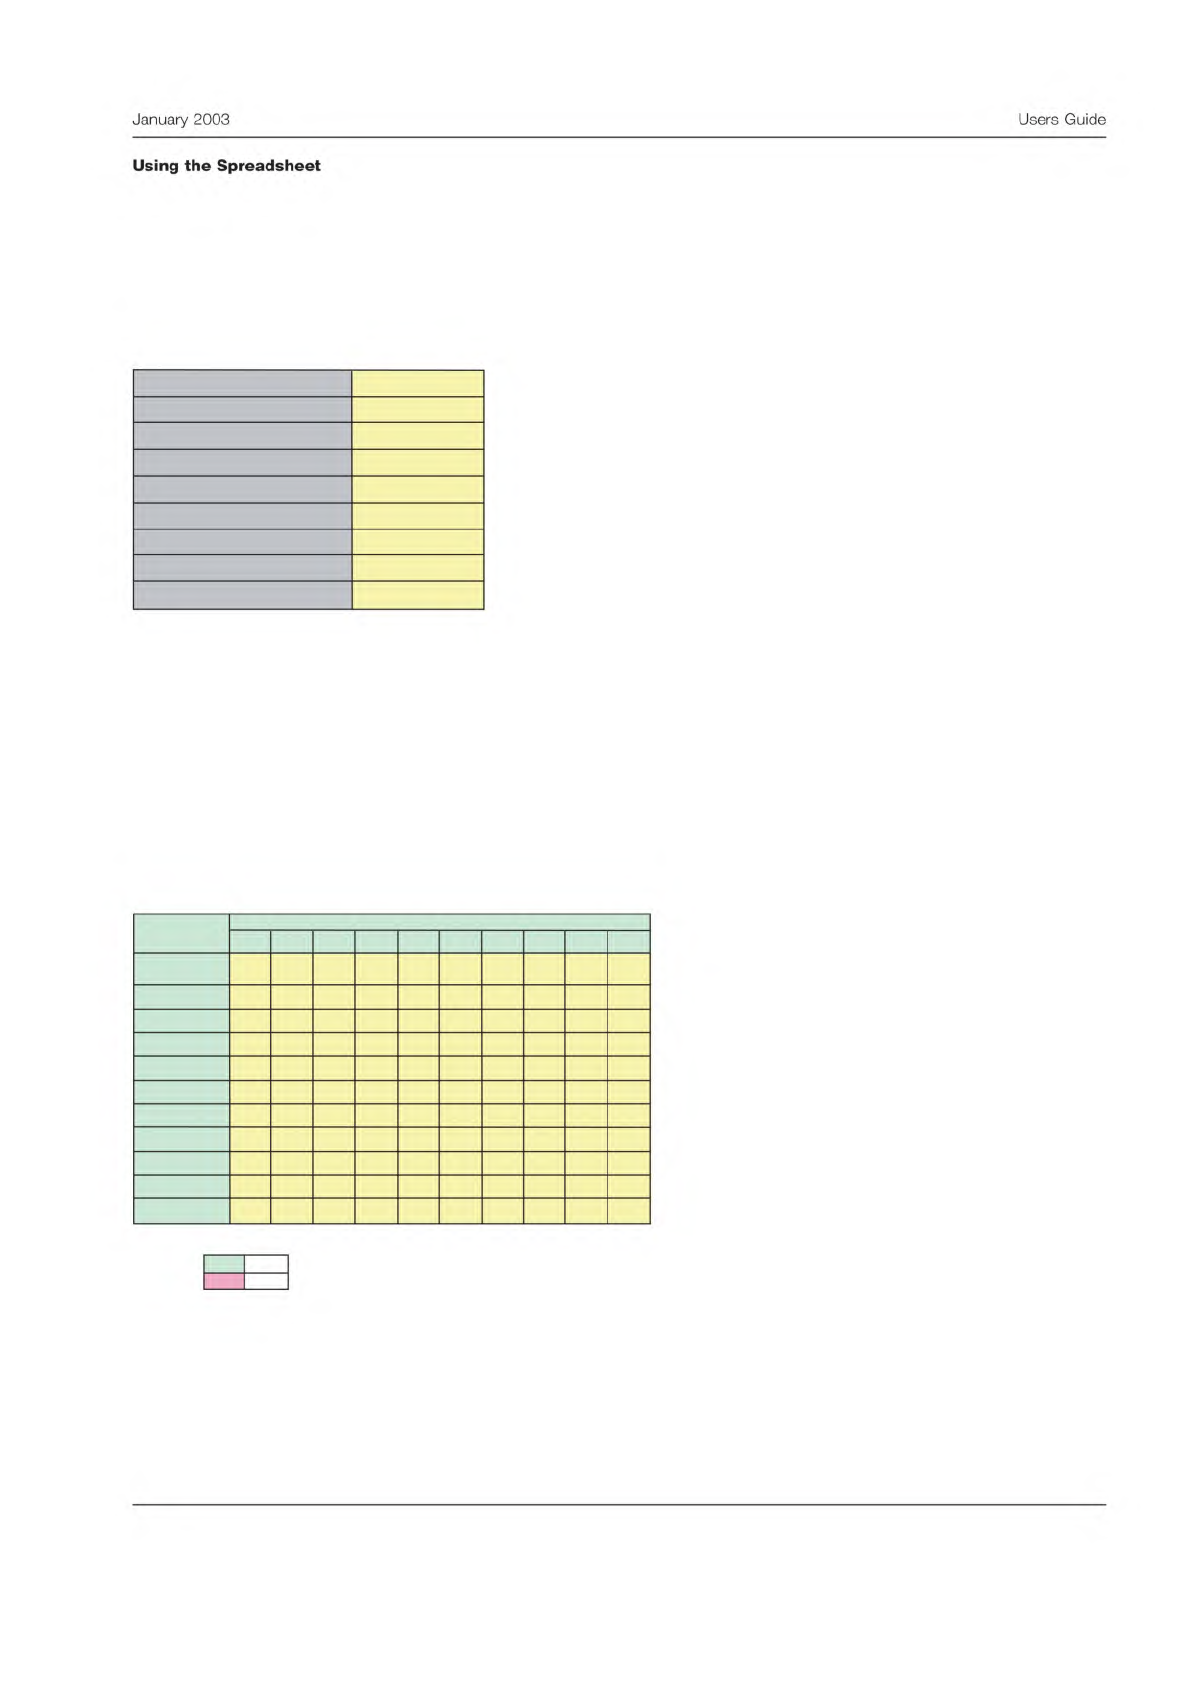
Header Section
Begin by completing the yellow area in the header. Fill in as completely as possible to prevent confusion later. The header
section is shown below.
Here, the example involves inspecting parts for solderability. It was decided to have two testers inspect 10 samples once a
day for two days.
The data can be entered in the next section. Again fill in the yellow areas. Be sure and check that the data was recorded
correctly and verify it is transcribed into the spreadsheet accurately. The analysis will be of little worth if there are typo-
graphical errors.
Data Entry Section
Below is a view of the data entry panel from the spreadsheet.
Note that the first line is the correct disposition. The other lines are for the various test conditions. The results must be coded
‘‘A’’ or ‘‘R’’. The code may be entered upper or lower case, but must be these codes.
Measurement Precision Study - Binary Data
Version 1.0, April 2002
Enter data into yellow areas.
Use an "A" for an acceptable product and an "R" for
a rejected product.
Number of Samples, n
10
Number of Test Conditions, m
2
Measurement Units
percent
Study Completion Date
Instrument
Company
Name of Study Organizer
Test Method
Inspection
Parameter Measured
Solderability
Data Entry Form
Enter data into the yellow area on the table below.
Use an "A" for an acceptable product and an "R" for a rejected product.
1 2
3 4 5 6 7 8 9 10
R A A R A R R A A A
R A A R R R R A A R
R A R R A A R A A R
R A A R R R R A A A
Important:
Use only these codes for this table:
Accept A
Reject
R
Tester
10
7
8
Samples
5
6
True Standard
1
2
3
4
9
3
January
2003
Users
Guide
Using
the
Spreadsheet
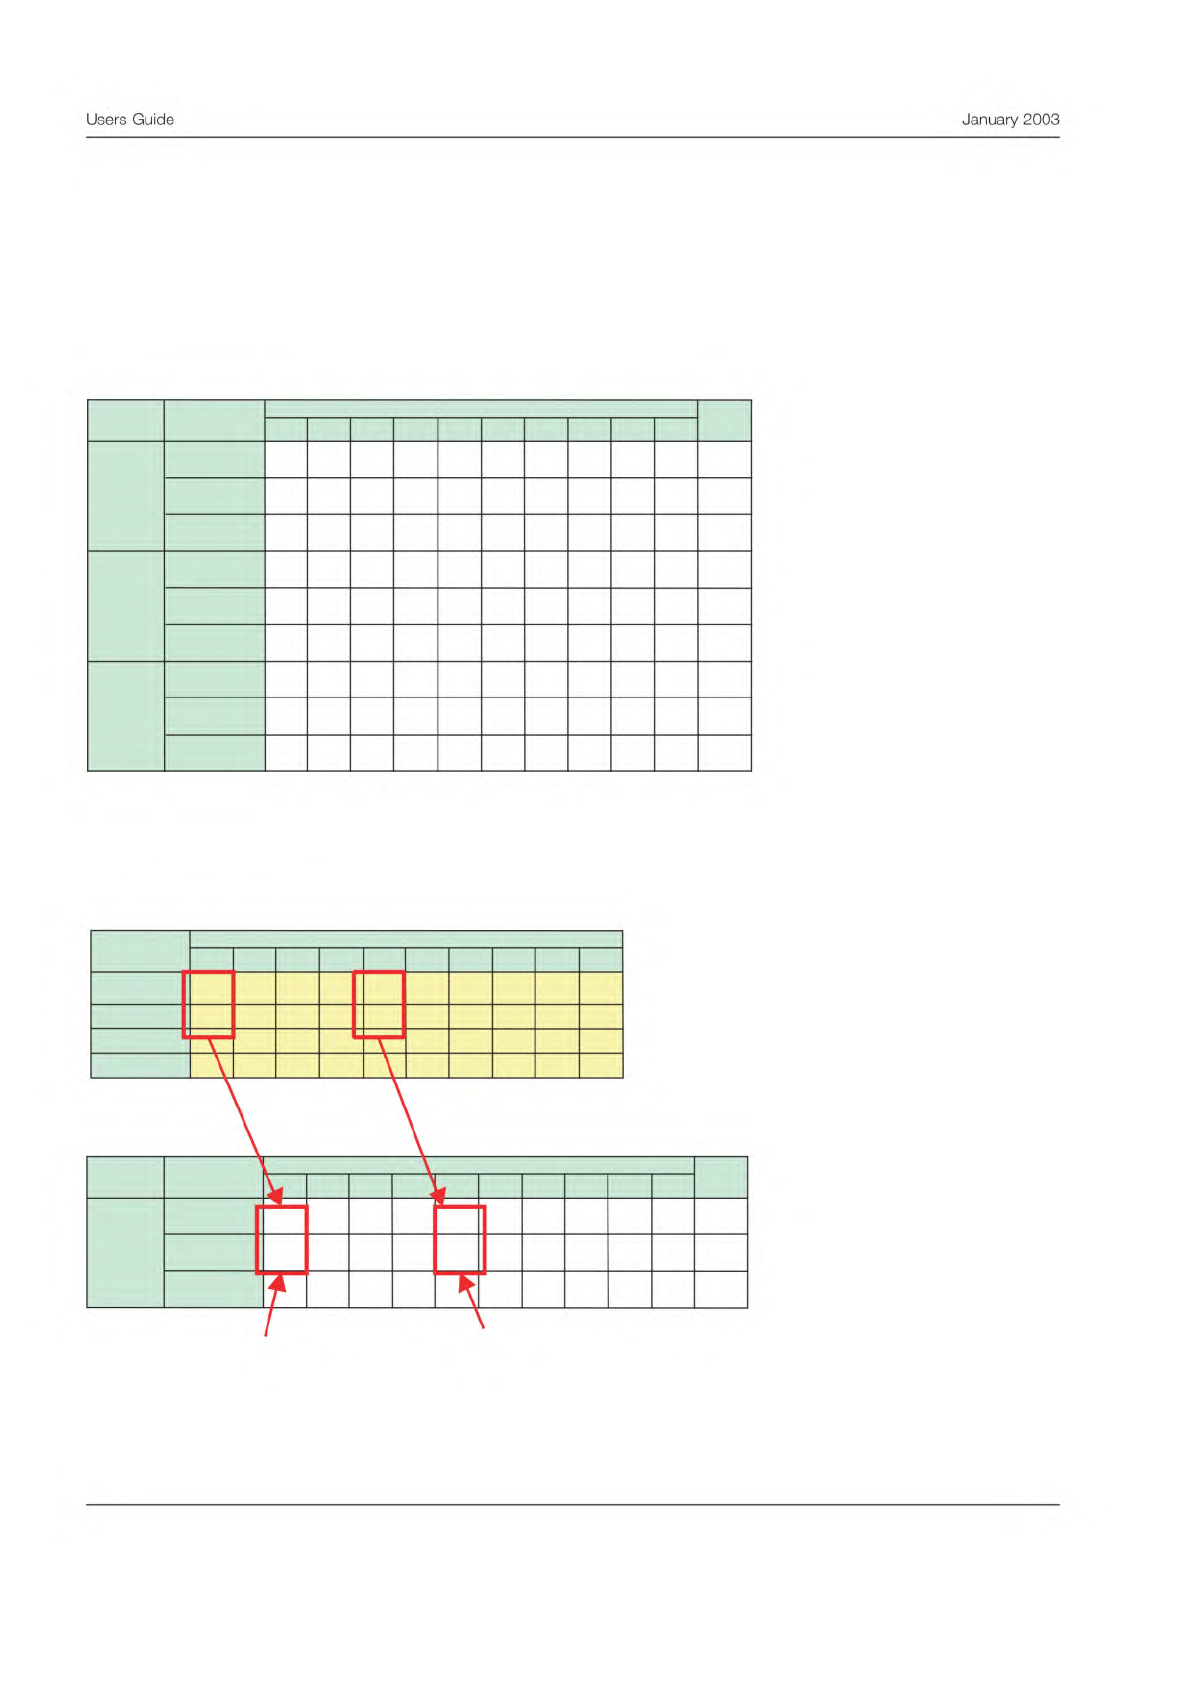
Intermediate Calculations
Because macros were avoided, the messy details of the calculations appear in the next section. If they make one nervous,
just hide them, and go directly to the Scorecard. One may, however, find these calculations helpful. Here is how this sec-
tion is organized:
The first table in the calculations section shows the disposition count. A ‘‘1’’ is scored whenever a disposition matches one
of the three conditions shown below. The count is scored for the following: when a part is dispositioned correctly, when
good part is rejected, and when a bad part is accepted.
The figure below shows how this count is accomplished:
Note that each of the dispositions is recorded on one, but only one, of the three lines.
Calculations
A "1" in the table below indicates how each part was dispositioned by each Tester.
1 2 3 4 5 6 7 8 9 10
1 1 1 1 0 1 1 1 1 0 8
0 0 0 0 1 0 0 0 0 1 2
0 0 0 0 0 0 0 0 0 0 0
1 1 0 1 1 0 1 1 1 0 7
0 0 1 0 0 0 0 0 0 1 2
0 0 0 0 0 1 0 0 0 0 1
1 1 1 1 0 1 1 1 1 1 9
0 0 0 0 1 0 0 0 0 0 1
0 0 0 0 0 0 0 0 0 0 0
Total
Sample
Result
Tester
1
2
3
Good and
Rejected
Bad and
Accepted
Dispositioned
Correctly
Good and
Rejected
Bad and
Accepted
Dispositioned
Correctly
Good and
Rejected
Bad and
Accepted
Dispositioned
Correctly
Data Entry Form
Enter data into the yellow area on the table below.
Use an "A" for an acceptable product as a "R" for a rejected product.
1 2 3 4
5 6
7
8
9
10
R A A R A R R A A A
R A A R R R R
A A R
R A R R A A R A A R
R A A R R R R A A A
Tester
Samples
True Standard
1
2
3
Calculations
A "1" in the table below indicates how each part was dispositioned by each Tester.
1 2 3 4 5 6 7 8 9 10
1 1 1 1 0 1 1 1 1 0 8
0 0 0 0 1 0 0 0 0 1 2
0 0 0 0 0 0 0 0 0 0 0
Total
Sample
ResultTester
1
Dispositioned
Correctly
Good and
Rejected
Bad and
Accepted
A good unit which
was rejected
Unit dispositioned
correctly
4
Users
Guide
January
2003
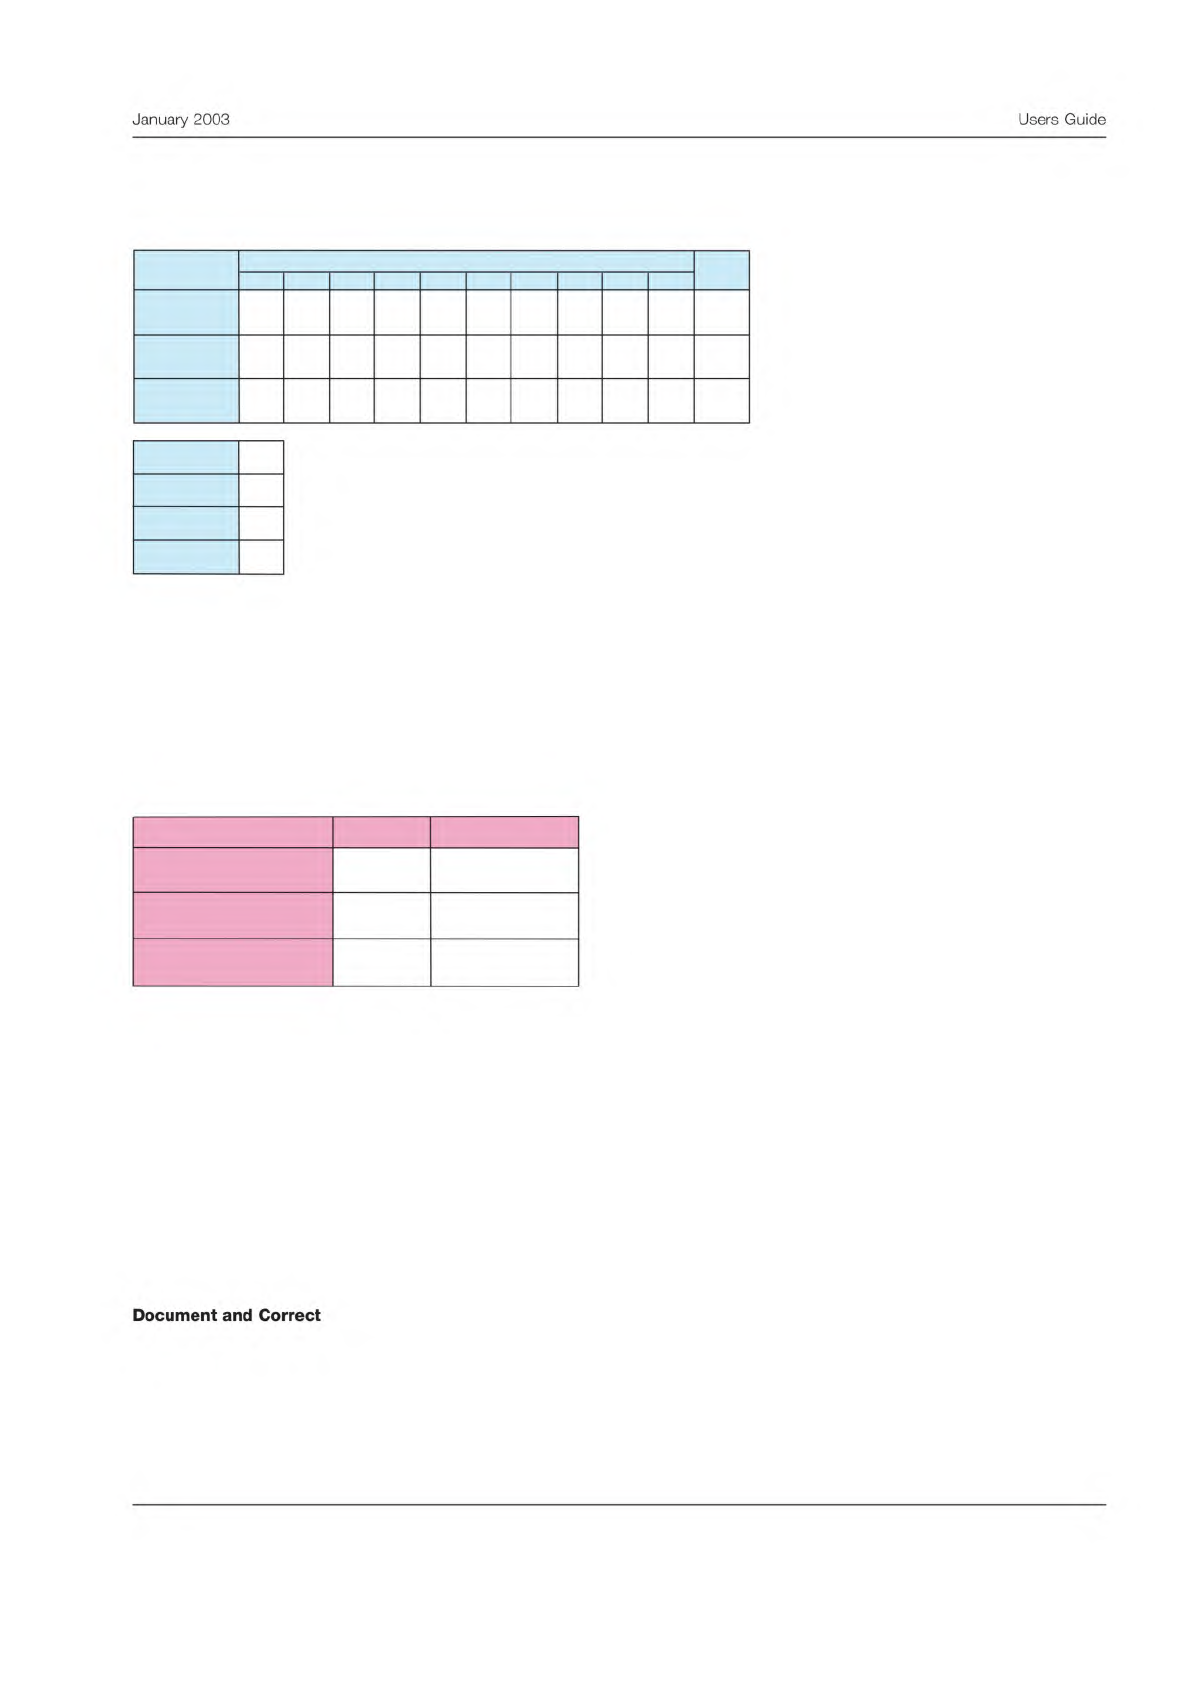
Scorecard
The final results are summarized and totaled on the scorecard.
The scorecard shows the total number of dispositions in each category for each tester. All testers are summed on the right
side on the table.
Below the scorecard is another table summarizing the number of tests performed, the number of good parts, the number of
bad parts, and the number of testers.
Test Effectiveness
The final section shows the test effectiveness calculation.
The first metric is the overall test effectiveness. This is a percentage, showing what portion of the dispositions were per-
formed correctly. A rule of thumb is that in a good test, the dispositions must be performed correctly at least 90% of the
time. Any test effectiveness less than 80% would be unacceptable. In this case the result is in the middle zone, where
improvement is recommended.
The next metric is the percent of good parts falsely rejected. In good tests, the false reject rate would be less than 5%. Any
test with a false reject rate greater than 10% needs improvement, which is the case here.
The final metric is the probability of passing bad parts. In a good test the false accept rate should be less than 2%. Any false
accept rate greater than 5% should be improved. That is the case here.
These results should be compared to the goals for the effectiveness of this inspection or test. These goals should be based
on the criticality of the outcome and probable impact of incorrect disposition.
The final step is to determine lessons learned from the MSA and document any changes to the test procedure. If the evalu-
ation indicates the test procedure needs to be improved, these improvement projects should be undertaken as soon as pos-
sible.
Measurement System Scorecard
1 2 3
4
5 6 7
8 9 10
8 7 9 0 0
0 0
0 0 0 24
2 2 1 0 0
0 0
0 0 0 5
0 1 0 0 0
0 0
0 0 0 1
30
6
4
3
Total tests
# of testers
Total
Tester
Results
Good parts
Bad parts
Dispositioned
Correctly
Good and
Rejected
Bad and
Accepted
Measurement System Effectiveness
Criteria Result Conclusion
80.0
27.8
8.3
Test effectiveness (%)
Probability of false rejects
(%)
Probability of false
acceptance (%)
Marginal
Needs improvement
Needs improvement
5
January
2003
Users
Guide
Document
and
Correct