IPC-TM-650 EN 2022 试验方法--.pdf - 第21页
For Use with T est Method 1.8, Measurement Systems Analysis fo r Binary Da ta (IPC Measurement Precision T ask Group (7-1 1a), V ersion 1.0) W elcome to the Me asurement Precision Calculator . This utility will help perf…
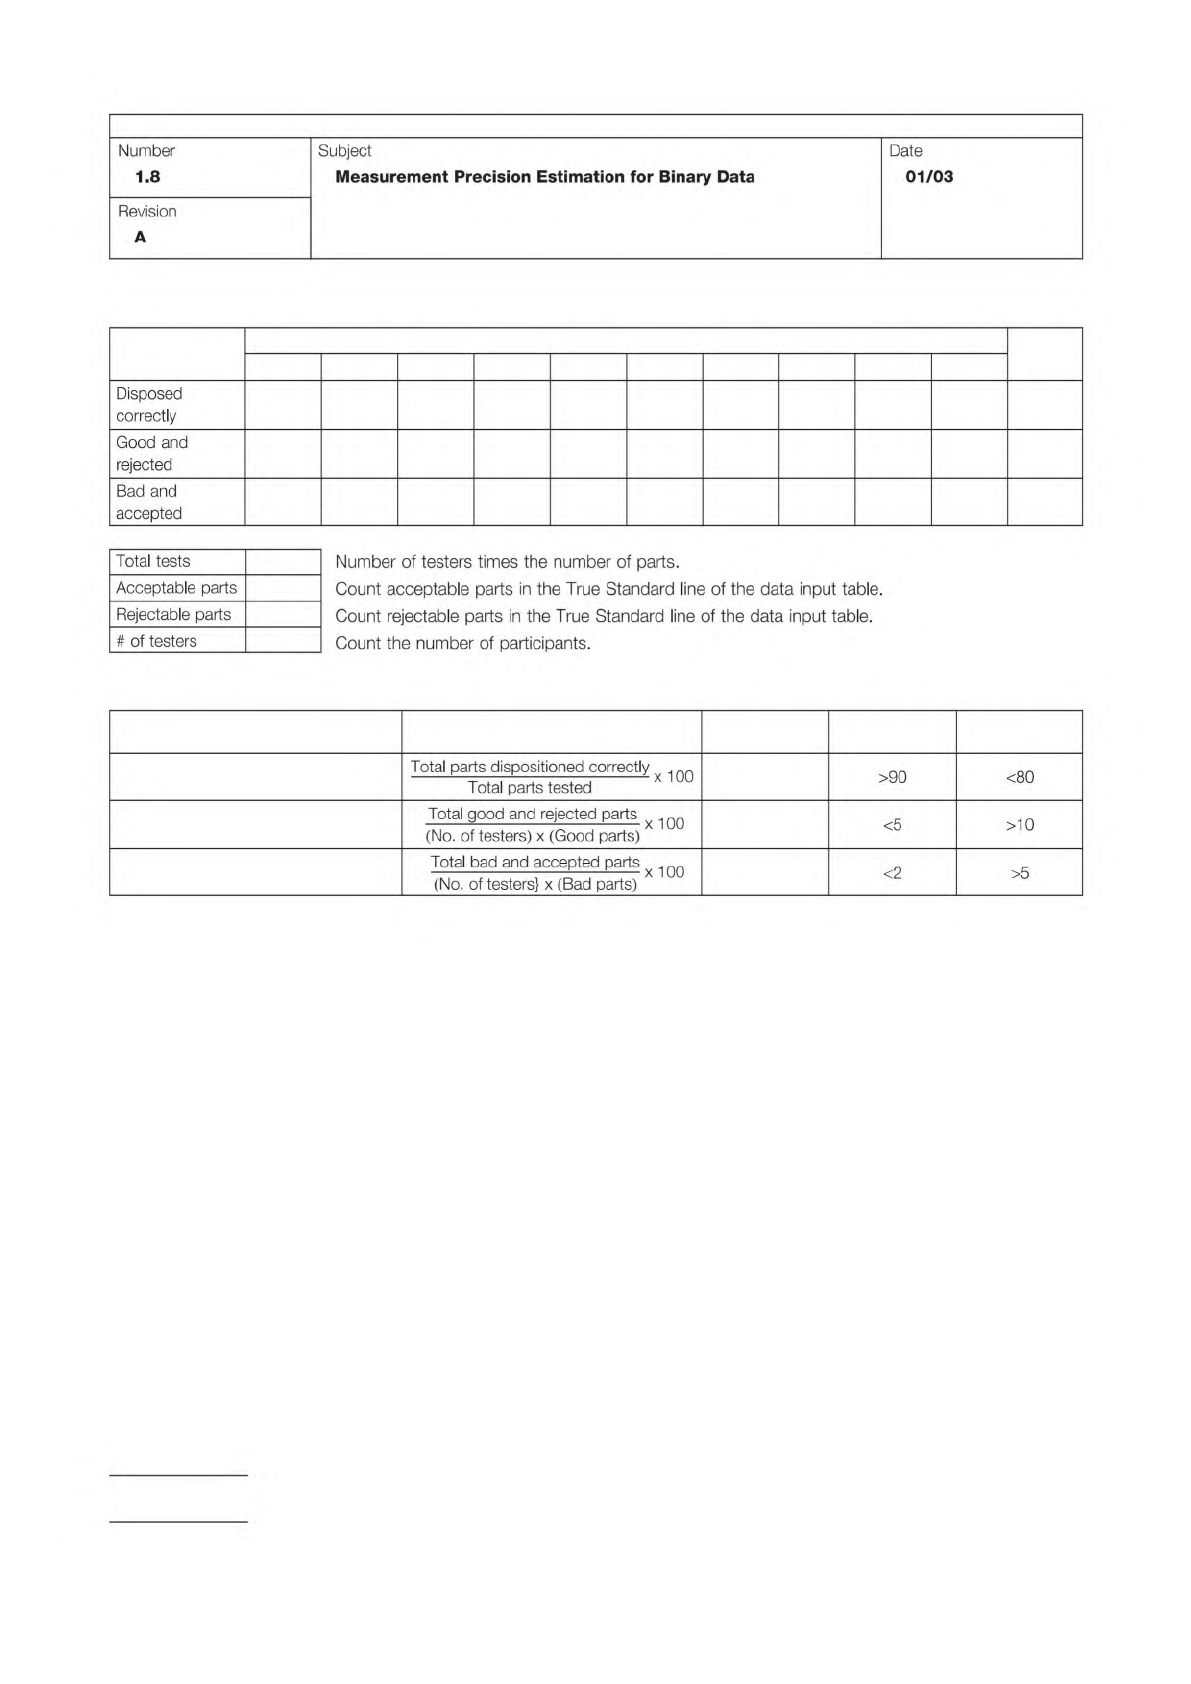
Table 5: Measurement System Scorecard
Results
Tester
1 2 3 4 5 6 7 8 9 10 Total
Table 6: Measurement System Effectiveness
Metric Calculation Result Acceptable
Needs
Improvement
Test effectiveness (%)
Probability of false rejects (%)
Probability of false acceptance (%)
IPC-TM-650
Page 6 of 6
Number
1.8
Subject
Measurement
Precision
Estimation
for
Binary
Data
Date
01/03
Revision
A
Disposed
correctly
Good
and
rejected
Bad
and
accepted
Total
tests
Number
of
testers
times
the
number
of
parts.
Acceptable
parts
Count
acceptable
parts
in
the
True
Standard
line
of
the
data
input
table.
Rejectable
parts
Count
rejectable
parts
in
the
True
Standard
line
of
the
data
input
table.
#
of
testers
Count
the
number
of
participants.
Total
parts
dispos
用
oond
correctly
x
也。
Total
parts
tested
>90
<80
Total
good
acd
rejected
parts
x
死。
(No.
of
testers)
x
(Good
parts)
<5
>10
Total
bad
and
accepted
parts
死。
(No.
of
testers}
x
(Bad
parts)
<2
>5
For Use with Test Method 1.8,
Measurement Systems Analysis for Binary Data
(IPC Measurement Precision Task Group (7-11a), Version 1.0)
Welcome to the Measurement Precision Calculator. This utility will help perform the calculations for Measurement Systems
Analysis (MSA) described in the IPC Test Method IPC-TM-1.8.
This software is useful in cases where the test or inspection results are recorded as binary data, resulting in one of two out-
comes, such as pass/fail or go/no-go. The calculations allow for results on up to 10 samples by up to 10 test conditions or
test laboratories.
Please refer to the test method before beginning the study. The test method defines the terms and equations used. This User
Guide provides instructions for analyzing the MSA data on the Measurement Precision Calculator, and how to draw conclu-
sions.
This software is an Excel workbook and includes the following:
• A blank spreadsheet to enter measurements
• A spreadsheet with example data
• A form for manual data entry, if desired.
The goal in preparing this workbook was to keep it as simple and easy to implement as possible, but still provide a good
basic MSA. This procedure has been used many times and can often be completed with as little as an hour’s work on each
of three consecutive days. This method provides a good initial assessment. It is quick and easy enough to be used on all
tests, current and new. It can help isolate cases where further analysis is needed. It is useful both on current production tests
and as a validation review for new designs.
This spreadsheet has been tested with the Excel versions included with Office 97 and Office 2000. It does not use macros,
so compatibility problems have been minimized. The sheets were formatted to print on 8-1/2 by 11 pages on most laser and
ink jet printers.
Begin by determining the measurement processes to be evaluated. All inspections are candidates for a study. In every case
where one performs a test or inspection, one deserves to know its effectiveness. What portion of the bad units will one miss?
What portion of the failed units will be good?
The secret to performing a good MSA is to prepare well. The first step in preparing the MSA is to identify all the MSA
candidates. Begin by identifying the inspections being performed. List the equipment needed, the parts tested, and the set-
ups required. For each piece of equipment, note the ranges used. The complete list of MSA candidates includes all combi-
nations of all tests, equipment, set-ups, ranges and all products.
As in many cases, this list probably includes far more potential candidates for an MSA than time or budget restrictions will
allow. So one must identify the top candidates and make sure the MSA begins with the most critical first.
The second step in preparing an MSA is to prioritize the candidates. The best ranking method for one’s situation will prob-
ably be unique, but there are several factors to consider.
1
January
2003
Users
Guide
Measurement
Precision
Calculator
Users
Guide
Introduction
Preparing
for
the
study

Beside each potential MSA candidate one could note information needed to help assess criticality. This information could
include the following:
• Issues identified as critical to customer (CTC) or quality (CTQ)
• Inspection or test cost
• Time required for test or inspection
• Unit cost of product being tested
• Planned production quantities
• Past yields
• Cost to analyze rejects
• Rework costs
• Scrap costs
• Warranty returns caused by issues with this test
Having this information, one could then devise a prioritizing scheme that would identify critical issues. Some have used the
planned production quantities and past yields to calculate potential costs of rework and scrap. A different prioritizing scheme
might use knowledge of issues critical to the customer or past warranty claims.
The third step in preparing the MSA is to take the rank ordered list and prepare an action plan. Given the time and budget
allowed, decide on the tests to be included in the first round of MSAs. After the first group has been analyzed, one can then
consider the second group, etc.
The test method gives more detailed instructions. Some rules of thumb and general pieces of advice are discussed below.
Many MSAs are discussed, but never completed. There are several reasons. For some the procedure is confusing. Hopefully,
this guide has helped streamline it here. For others, the process is too time consuming and expensive. While it is true that
more samples and more testers will yield more precise estimates; nevertheless, an incomplete study is useless.
Therefore, it is recommended that one start small and efficient MSAs. Pick the highest priority test and design an MSA that
can be performed quickly with the time and resources available. If this initial study shows the need for improvement, then
call an expert practitioner and design a more extensive study and begin corrective action.
In many cases a good basic study may involve just five parts, two to three testers, and three of four inspections on each part
by each tester. Each tester could inspect each part once a day for several days.
Begin with the highest priority test, then continue with the rest. Many have found that a small effort continued over the long
term can accomplish more than a single massive initiative. Develop a plan to reassess the MSA on a regular basis. It is
important to track the effect of the MSA efforts, both in terms of the performance metric involved and in cycle time and cost
savings. Choose a representative group of samples for the MSA. Choose samples that cover the part type, range and set-up
under consideration. Be sure to use testers who represent those who will actually do the test or inspection during produc-
tion.
Have a subject matter expert inspect the parts carefully before the study begins and be completely sure how the product
should be dispositioned. Dedicate enough time to this step to be sure of the diagnosis. This analysis is generally much more
time consuming and expensive than the normal inspection.
Present the products to the testers in a manner that prevents them from knowing the prior results. This prior knowledge may
influence their current judgment and compromise the study.
During the study, perform the test or inspection as it will be performed during normal production. Do not set a part aside
if it happens to result in a noncompliance. Continue making inspections.
Do not ignore any of the inspections, unless there was a special cause of variation that is clearly identified and preventative
action has been taken.
2
Users
Guide
January
2003
Setting-up
the
MSA