IPC-TM-650 EN 2022 试验方法--.pdf - 第517页
6 Special Considerations a nd Notes 6.1 Gen eral 6. 1.1 Q ual ity Contr ol Me asu reme nt s fo r ma nuf act urin g control are performed to identify and correct pr oce ss or m ate- rials problems occurring during a manuf…
ASTM-D-257
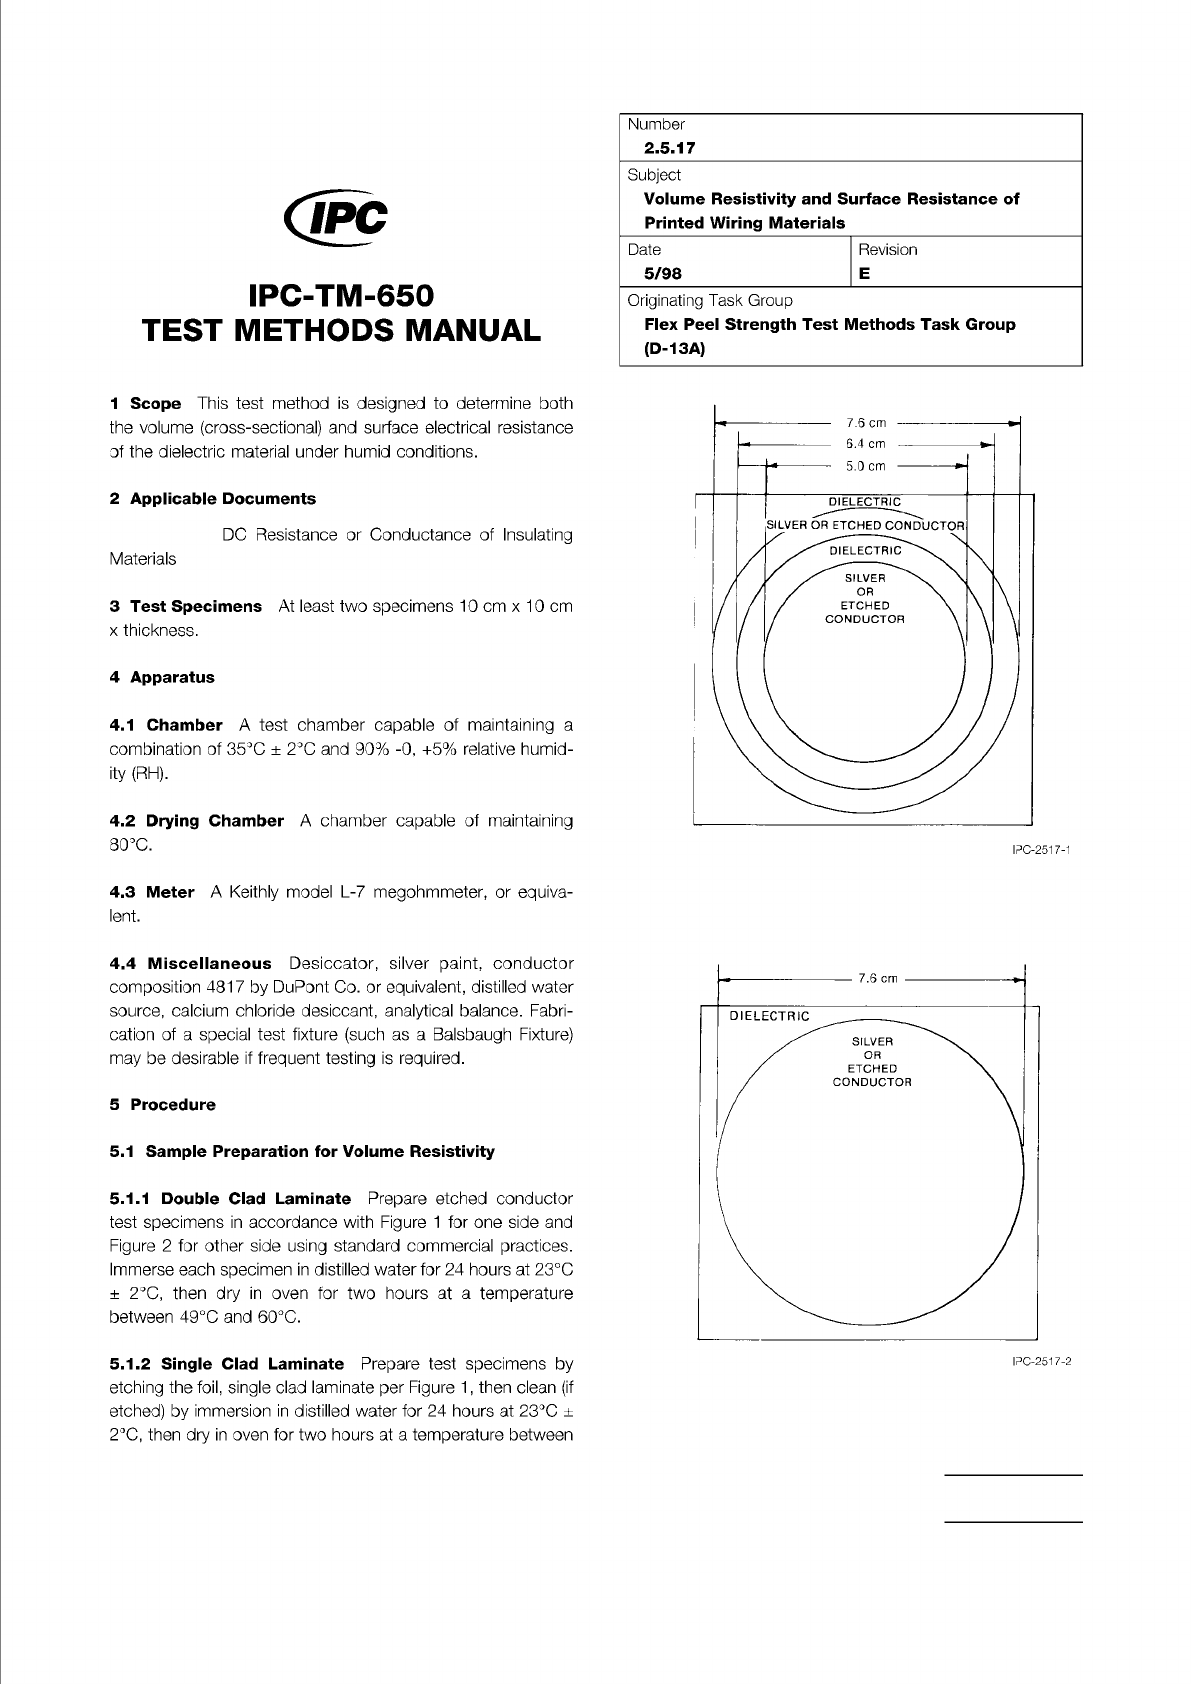
Figure 1 Volume and Surface Resistivity Test Pattern.
(Side 1)
Figure 2 Volume and Surface Resistivity Test Pattern.
(Side 2)
The Institute for Interconnecting and Packaging Electronic Circuits
2215 Sanders Road • Northbrook, IL 60062
Material in this Test Methods Manual was voluntarily established by Technical Committees of the IPC. This material is advisory only
and its use or adaptation is entirely voluntary. IPC disclaims all liability of any kind as to the use, application, or adaptation of this
material. Users are also wholly responsible for protecting themselves against all claims or liabilities for patent infringement.
Equipment referenced is for the convenience of the user and does not imply endorsement by the IPC.
Page 1 of 2
IPC-TM-650
TEST
METHODS
MANUAL
1
Scope
This
test
method
is
designed
to
determine
both
the
volume
(cross-sectional)
and
surface
electrical
resistance
of
the
dielectric
material
under
humid
conditions.
2
Applicable
Documents
DC
Resistance
or
Conductance
of
Insulating
Materials
3
Test
Specimens
At
least
two
specimens
10
cm
x
10
cm
x
thickness.
4
Apparatus
4.1
Chamber
A
test
chamber
capable
of
maintaining
a
combination
of
35℃
±
2
℃
and
90%
-0,
+5%
relative
humid¬
ity
(RH).
4.2
Drying
Chamber
A
chamber
capable
of
maintaining
80℃.
4.3
Meter
A
Keithly
model
L-7
megohmmeter,
or
equiva¬
lent.
4.4
Miscellaneous
Desiccator,
silver
paint,
conductor
composition
4817
by
DuPont
Co.
or
equivalent,
distilled
water
source,
calcium
chloride
desiccant,
analytical
balance.
Fabri¬
cation
of
a
special
test
fixture
(such
as
a
Balsbaugh
Fixture)
may
be
desirable
if
frequent
testing
is
required.
5
Procedure
5.1
Sample
Preparation
for
Volume
Resistivity
5.1.1
Double
Clad
Laminate
Prepare
etched
conductor
test
specimens
in
accordance
with
Figure
1
for
one
side
and
Figure
2
for
other
side
using
standard
commercial
practices.
Immerse
each
specimen
in
distilled
water
for
24
hours
at
23℃
±
2
℃,
then
dry
in
oven
for
two
hours
at
a
temperature
between
49℃
and
60℃.
5.1.2
Single
Clad
Laminate
Prepare
test
specimens
by
etching
the
foil,
single
clad
laminate
per
Figure
1
,
then
clean
(if
etched)
by
immersion
in
distilled
water
for
24
hours
at
23℃
±
2
℃,
then
dry
in
oven
for
two
hours
at
a
temperature
between
Number
2.5.17
Subject
Volume
Resistivity
and
Surface
Resistance
of
Printed
Wiring
Materials
Date
Revision
5/98
E
Originating
Task
Group
Flex
Peel
Strength
Test
Methods
Task
Group
(D-13A)

6 Special Considerations and Notes
6.1 General
6.1.1 Quality Control
Measurements for manufacturing
control are performed to identify and correct process or mate-
rials problems occurring during a manufacturing run, as well
as to assure that a product will perform electrically as
designed. To facilitate the large number of measurements
required in a production environment, and to maximize mea-
surement repeatability and reproducibility between different
operators and test systems, it is particularly useful to auto-
mate the TDR calibration and measurement by using com-
puter control. This can be easily achieved using a computer
and suitable automation equipment, resulting in access to suf-
ficient repeated measurements to track the statistics of
parameter variation.
The following list provides examples of parameter variations
detectable by TDR, and that are evidence of process or mate-
rials problems:
a. Over/under-etching (line width problems)
b. Over/under-plating (line width and thickness problems)
c. Permittivity of the dielectric
d. Thickness of the dielectric
e. Degradation from excessive heating and humidity
f. Damage from excessive pressure during the multilayer pro-
cess
g. Variations in the laminate glass-to-resin content
h. Variations in additional coatings applied to the PB surface,
e.g., solder mask
Measurement repeatability is described in IPC-TM-650,
Method 1.9, ‘‘Measurement Precision Estimation for Variables
Data.’’ Method 1.9 also describes a process to evaluate the
reproducibility of a measurement system for multiple opera-
tors, on different days, and when using different instruments.
This evaluation process should be followed and a precision-
to-tolerance ratio acceptable to the customer should be
obtained.
6.1.2 Single-Ended and Differential Lines
Increased
performance requirements for computer and other electronic
products often demand even greater signal fidelity, time pre-
cision, and noise immunity than can be obtained with a single-
ended transmission line. A single-ended transmission line is a
transmission line design consisting of a single signal conduc-
tor placed over one ground plane, as in a microstrip, or
between two ground planes, as in a stripline. Single-ended
lines may be called unbalanced transmission lines. Differential
lines are used to increase signal fidelity with improved time
precision and increased noise immunity to common-mode
sources. Differential lines may also be called balanced or
coupled transmission lines. The required TDR sources and
samplers are different for differential lines, as are the probes
used to make contact to the test structures, but this method
is directly applicable to differential waveforms.
6.1.3 Environmental Factors
Temperature and humidity
should be monitored during the test. Long exposures to tem-
perature and humidity other than standard laboratory condi-
tions (temperature range of 20 to 23 °C and relative humidity
range of 35 to 65%) can affect the dielectric properties of the
materials in the test objects, and thus the propagation delay.
Furthermore, the electrical characteristics of the TDR, such as
sampler gain, are temperature dependent. Therefore, for the
most repeatable measurements, the TDR instrumentation
should be maintained within the manufacturer recommended
temperature and humidity ranges. Low relative humidity may
result in electrostatic discharge damage to the TDR unit.
6.1.4 Measurement Accuracy and Repeatability
Accu-
racy and repeatability depend on the impedance of the line
being measured, the type and condition of probes, cables,
sampling head, and the experience of the test technician.
Accuracy is the difference between the most likely measure-
ment and the defined standard. The most likely measurement
is also called the mode of all measurements within a sample
set. Three times the standard deviation around each side of
the mode is the repeatability.
The ability to resolve a measurement value is fundamental to
the accuracy of any measurement process. The TDR instru-
ment should have sufficient measurement resolution to facili-
tate the accuracy requirements of the measurement method
described herein. The total risetime of the TDR system (includ-
ing cables, probes, etc.) and step aberrations define the
impedance resolution (see 4.1.2).
6.1.5 General Cautionary Statement
TDR test systems
and associated accessories are precision high frequency
devices. Most TDRs include hardware to protect the static-
sensitive sampling heads. However, operators and mainte-
nance staff should take proper ESD precautions (see manu-
facturer’s recommendations). High frequency cables, because
they typically use solid center conductors, are not as flexible
as typical coaxial cables. Consequently, care should be taken
not to excessively bend and flex the high frequency cables.
Number
2.5.5.11
Subject
Propagation Delay of Lines on Printed Boards by TDR
Date
04/2009
Revision
IPC-TM-650
Page
13
of
16

The probes used in TDR systems typically use spring-loaded
contacting mechanisms and these should be checked peri-
odically to ensure proper operation. Statistical process control
methods and control charts can provide useful information
regarding the condition of the TDR system and its associated
accessories.
6.1.6 Measured Values
The units of the delay values
computed using waveforms acquired by the TDR system are
in seconds. Propagation delay, which is in units of time per
unit distance (typically, s/m), is determined as described in
Section 5.
6.2 Calibration
6.2.1 Verification Field Check – Check Standards
The
mechanical tolerances of air line check standards should be
verified using mechanical gauges at each use. Damaged air
lines should be repaired and recalibrated before use. They
should always be handled with care. The air line should also
be calibrated and documented periodically (not less than once
every two years) by a qualified certification laboratory and kept
in an environment safe from mechanical shocks, dust and dirt.
Dust and dirt degrade the fine threads of the connection and
damage the electrical mating surfaces. Also, some TDR
equipment manufacturers have requirements for the minimum
length of the air line artifacts. The user should check with the
manufacturer regarding limits. For differential impedance of
100 Ω, each channel can be checked with a 50 Ω air line.
6.3 Measurement System
6.3.1 Bandwidth/Risetime Resolution
The frequency
components of the TDR step are approximately related to the
bandwidth by:
BW
−3dB
≈
0.35
t
d
,
where
BW
-3dB
is the 3 dB attenuation bandwidth and
t
d
is the 10 - 90% transition duration of the TDR
step response.
Note that this relationship may not accurately represent the
intended operational frequencies of the transmission line
being tested. The bandwidth and risetime characteristics must
be adequate to ensure the TDR can provide a waveform
epoch appropriate to accurately determine t
d
for a transmis-
sion line of a given length. This waveform epoch must provide
sufficient resolution (see 4.1.2) to accurately determine the
reference level instants (see 5.1.3) and be long enough to
ensure the TDR waveform has settled to a nominal value (nec-
essary for accurate computation of pulse amplitude.) Risetime
considerations, however, are not the best method for deter-
mining TDR resolution. It is better to consider the temporal/
spatial resolution of the TDR (see 4.1.2) than bandwidth/
risetime resolution when determining the performance of the
TDR measurement system.
6.3.2 Temporal/Spatial Resolution
The TDR unit may
not be the only limiting factor for temporal resolution. The
probe connecting the TDR unit to the test specimen may also
limit resolution and this needs to be considered. Because of
the nature of TDR, it is easy to include the effects of the TDR
unit and all of the probe devices collectively, by defining t
sys
as
the fall time of the TDR step that has reflected from a short
circuit placed at the end of the probe and returned to the TDR
head.
6.3.3 Amplitude Scale
If a coarse vertical scale is used,
quantization error can be significant in certain instruments.
Many instruments change accuracy when their scales are
changed, and this can result in significant but unknown errors
in t
d
.
6.3.4 Baseline and Amplitude Drift
The ability of the TDR
instrument to maintain a constant baseline voltage and con-
stant amplitude step pulse are critical to the repeatability of
the TDR measurement process. TDR step generators and
sampling units are sensitive to time and temperature drifts.
Drift should be minimized and have a value that corresponds
to less than one-tenth the desired t
d
uncertainty.
6.3.5 Electrostatic Discharge Damage
ESD damage to
TDR instrumentation is often not easily detected and may
unknowingly affect measurement accuracy. Therefore, system
calibration should be performed regularly to check for this (see
5.1.1). All cables should have a termination attached to one
end when not in use and while they are being connected to
the TDR instrumentation. The use of a static protection switch
helps eliminate ESD damage to the TDR. Operators should
have anti-static awareness training and should perform all
measurements in anti-static work areas while wearing anti-
static wrist straps.
6.3.6 Probes
Hand-held probing solutions are sensitive to
operator technique and may have a larger contribution to
uncertainty due to repeatability of connections compared to
Number
2.5.5.11
Subject
Propagation Delay of Lines on Printed Boards by TDR
Date
04/2009
Revision
IPC-TM-650
Page
14
of
16