IPC-TM-650 EN 2022 试验方法--.pdf - 第27页
Header Section Begin by completing the yellow area in the header . Fill in as completely as possible to prevent confusion later . The header section i s sho wn below . Here, the example involves inspecting parts for sold…

Beside each potential MSA candidate one could note information needed to help assess criticality. This information could
include the following:
• Issues identified as critical to customer (CTC) or quality (CTQ)
• Inspection or test cost
• Time required for test or inspection
• Unit cost of product being tested
• Planned production quantities
• Past yields
• Cost to analyze rejects
• Rework costs
• Scrap costs
• Warranty returns caused by issues with this test
Having this information, one could then devise a prioritizing scheme that would identify critical issues. Some have used the
planned production quantities and past yields to calculate potential costs of rework and scrap. A different prioritizing scheme
might use knowledge of issues critical to the customer or past warranty claims.
The third step in preparing the MSA is to take the rank ordered list and prepare an action plan. Given the time and budget
allowed, decide on the tests to be included in the first round of MSAs. After the first group has been analyzed, one can then
consider the second group, etc.
The test method gives more detailed instructions. Some rules of thumb and general pieces of advice are discussed below.
Many MSAs are discussed, but never completed. There are several reasons. For some the procedure is confusing. Hopefully,
this guide has helped streamline it here. For others, the process is too time consuming and expensive. While it is true that
more samples and more testers will yield more precise estimates; nevertheless, an incomplete study is useless.
Therefore, it is recommended that one start small and efficient MSAs. Pick the highest priority test and design an MSA that
can be performed quickly with the time and resources available. If this initial study shows the need for improvement, then
call an expert practitioner and design a more extensive study and begin corrective action.
In many cases a good basic study may involve just five parts, two to three testers, and three of four inspections on each part
by each tester. Each tester could inspect each part once a day for several days.
Begin with the highest priority test, then continue with the rest. Many have found that a small effort continued over the long
term can accomplish more than a single massive initiative. Develop a plan to reassess the MSA on a regular basis. It is
important to track the effect of the MSA efforts, both in terms of the performance metric involved and in cycle time and cost
savings. Choose a representative group of samples for the MSA. Choose samples that cover the part type, range and set-up
under consideration. Be sure to use testers who represent those who will actually do the test or inspection during produc-
tion.
Have a subject matter expert inspect the parts carefully before the study begins and be completely sure how the product
should be dispositioned. Dedicate enough time to this step to be sure of the diagnosis. This analysis is generally much more
time consuming and expensive than the normal inspection.
Present the products to the testers in a manner that prevents them from knowing the prior results. This prior knowledge may
influence their current judgment and compromise the study.
During the study, perform the test or inspection as it will be performed during normal production. Do not set a part aside
if it happens to result in a noncompliance. Continue making inspections.
Do not ignore any of the inspections, unless there was a special cause of variation that is clearly identified and preventative
action has been taken.
2
Users
Guide
January
2003
Setting-up
the
MSA
Header Section
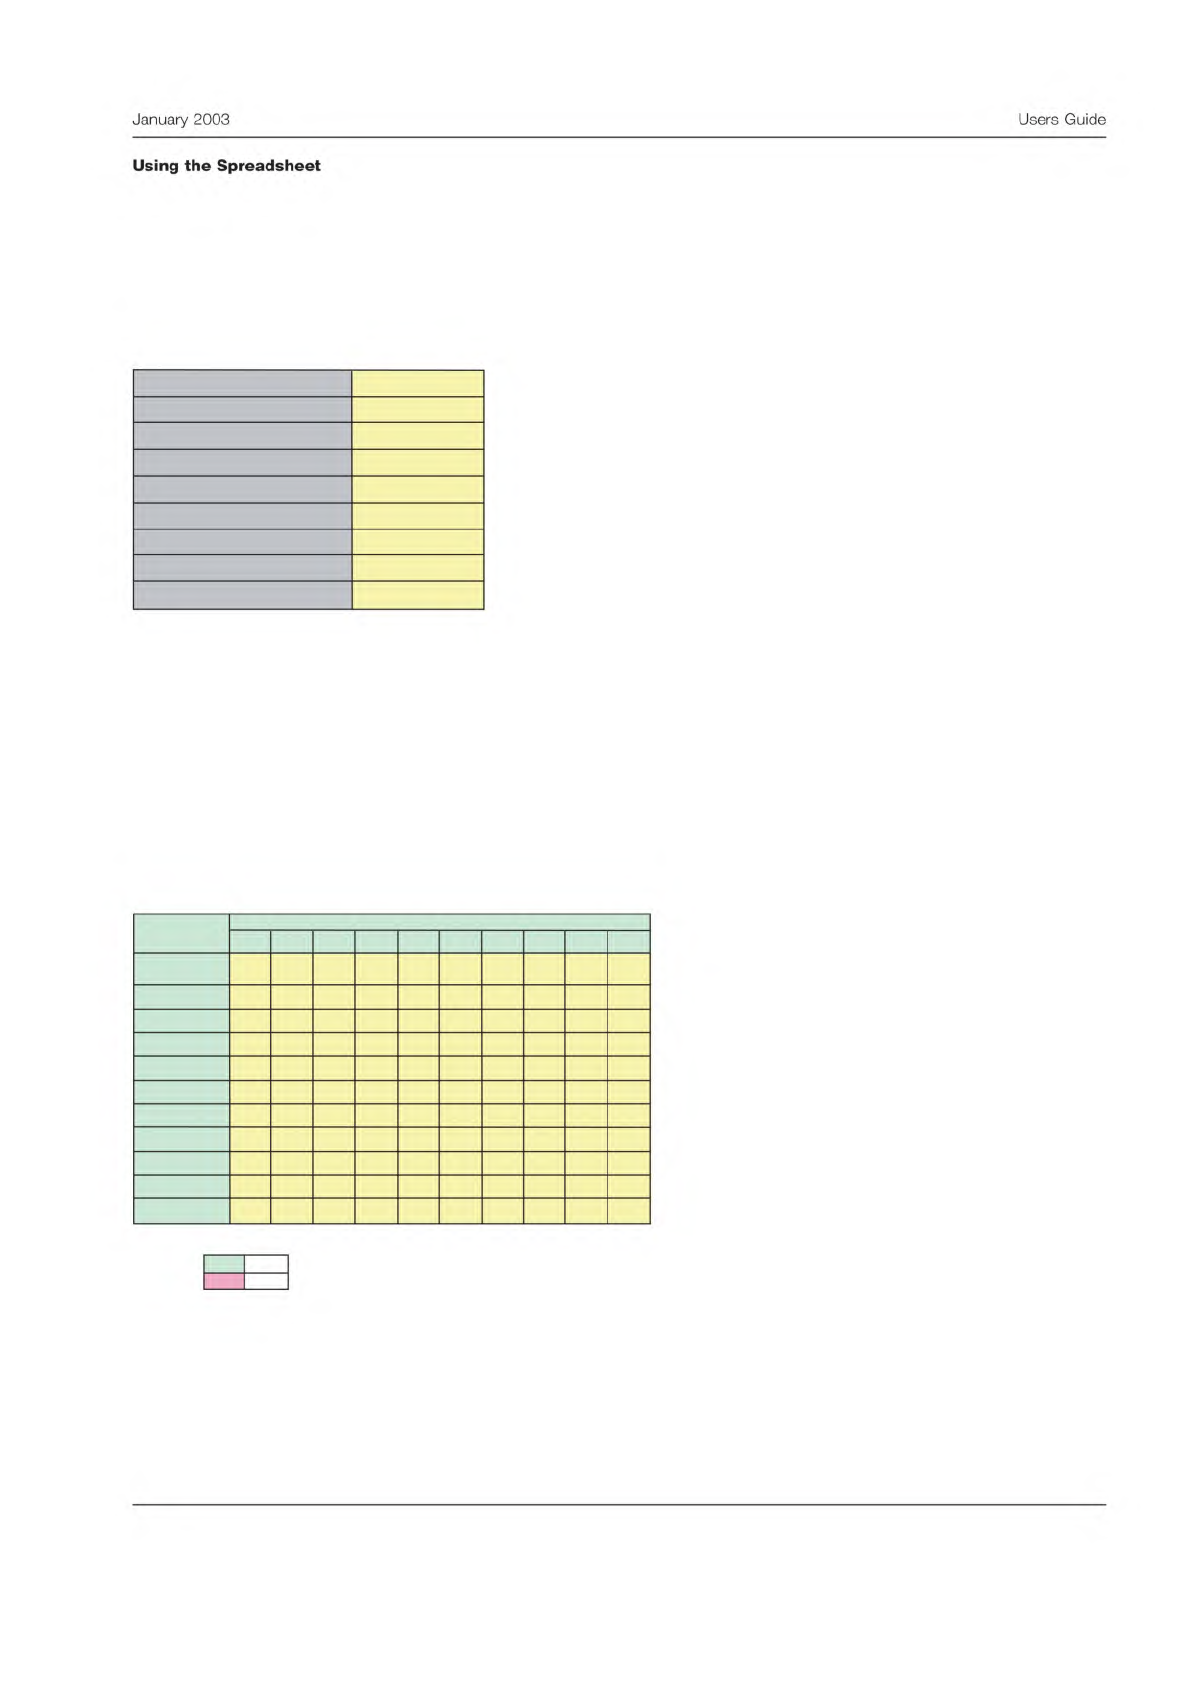
Begin by completing the yellow area in the header. Fill in as completely as possible to prevent confusion later. The header
section is shown below.
Here, the example involves inspecting parts for solderability. It was decided to have two testers inspect 10 samples once a
day for two days.
The data can be entered in the next section. Again fill in the yellow areas. Be sure and check that the data was recorded
correctly and verify it is transcribed into the spreadsheet accurately. The analysis will be of little worth if there are typo-
graphical errors.
Data Entry Section
Below is a view of the data entry panel from the spreadsheet.
Note that the first line is the correct disposition. The other lines are for the various test conditions. The results must be coded
‘‘A’’ or ‘‘R’’. The code may be entered upper or lower case, but must be these codes.
Measurement Precision Study - Binary Data
Version 1.0, April 2002
Enter data into yellow areas.
Use an "A" for an acceptable product and an "R" for
a rejected product.
Number of Samples, n
10
Number of Test Conditions, m
2
Measurement Units
percent
Study Completion Date
Instrument
Company
Name of Study Organizer
Test Method
Inspection
Parameter Measured
Solderability
Data Entry Form
Enter data into the yellow area on the table below.
Use an "A" for an acceptable product and an "R" for a rejected product.
1 2
3 4 5 6 7 8 9 10
R A A R A R R A A A
R A A R R R R A A R
R A R R A A R A A R
R A A R R R R A A A
Important:
Use only these codes for this table:
Accept A
Reject
R
Tester
10
7
8
Samples
5
6
True Standard
1
2
3
4
9
3
January
2003
Users
Guide
Using
the
Spreadsheet
Intermediate Calculations
Because macros were avoided, the messy details of the calculations appear in the next section. If they make one nervous,
just hide them, and go directly to the Scorecard. One may, however, find these calculations helpful. Here is how this sec-
tion is organized:
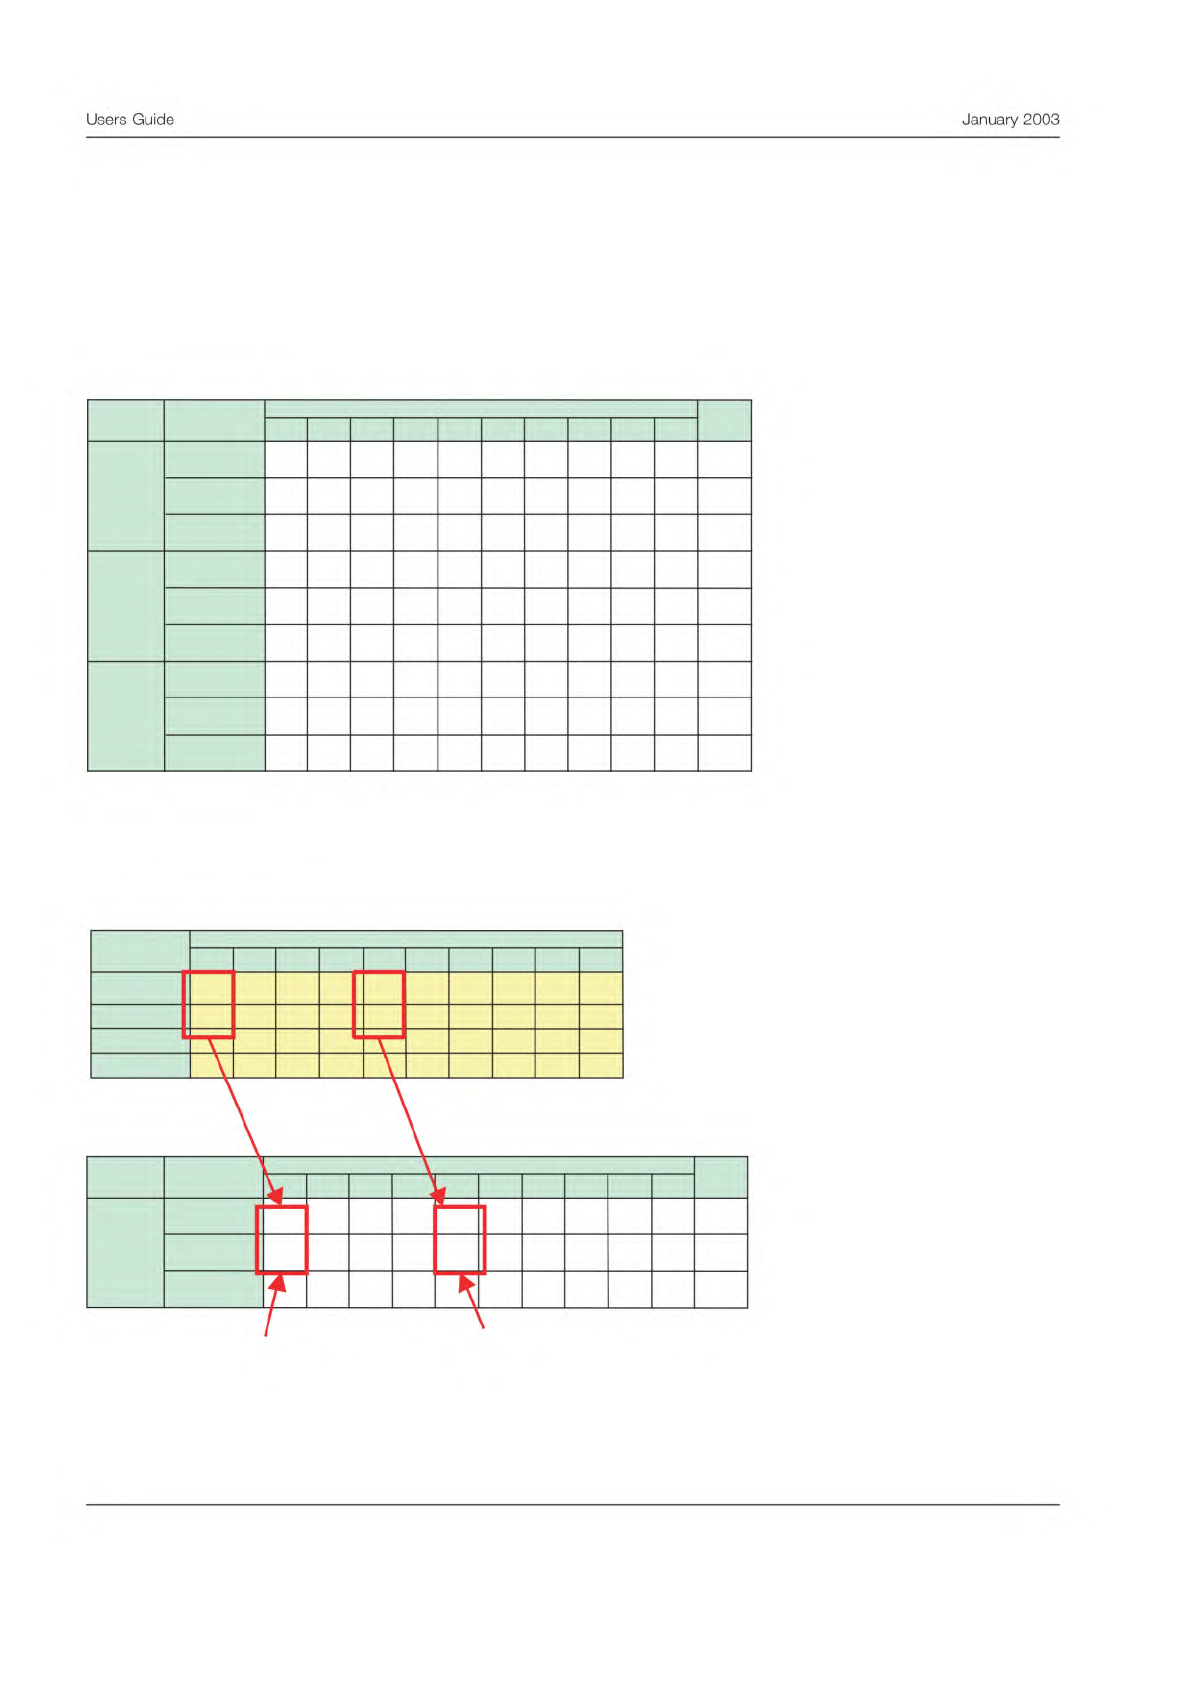
The first table in the calculations section shows the disposition count. A ‘‘1’’ is scored whenever a disposition matches one
of the three conditions shown below. The count is scored for the following: when a part is dispositioned correctly, when
good part is rejected, and when a bad part is accepted.
The figure below shows how this count is accomplished:
Note that each of the dispositions is recorded on one, but only one, of the three lines.
Calculations
A "1" in the table below indicates how each part was dispositioned by each Tester.
1 2 3 4 5 6 7 8 9 10
1 1 1 1 0 1 1 1 1 0 8
0 0 0 0 1 0 0 0 0 1 2
0 0 0 0 0 0 0 0 0 0 0
1 1 0 1 1 0 1 1 1 0 7
0 0 1 0 0 0 0 0 0 1 2
0 0 0 0 0 1 0 0 0 0 1
1 1 1 1 0 1 1 1 1 1 9
0 0 0 0 1 0 0 0 0 0 1
0 0 0 0 0 0 0 0 0 0 0
Total
Sample
Result
Tester
1
2
3
Good and
Rejected
Bad and
Accepted
Dispositioned
Correctly
Good and
Rejected
Bad and
Accepted
Dispositioned
Correctly
Good and
Rejected
Bad and
Accepted
Dispositioned
Correctly
Data Entry Form
Enter data into the yellow area on the table below.
Use an "A" for an acceptable product as a "R" for a rejected product.
1 2 3 4
5 6
7
8
9
10
R A A R A R R A A A
R A A R R R R
A A R
R A R R A A R A A R
R A A R R R R A A A
Tester
Samples
True Standard
1
2
3
Calculations
A "1" in the table below indicates how each part was dispositioned by each Tester.
1 2 3 4 5 6 7 8 9 10
1 1 1 1 0 1 1 1 1 0 8
0 0 0 0 1 0 0 0 0 1 2
0 0 0 0 0 0 0 0 0 0 0
Total
Sample
ResultTester
1
Dispositioned
Correctly
Good and
Rejected
Bad and
Accepted
A good unit which
was rejected
Unit dispositioned
correctly
4
Users
Guide
January
2003