IPC-TM-650 EN 2022 试验方法--.pdf - 第657页
Figure 1 Moisture and Insulation Resistance T est Graph Figure 2 Insulation Resis tanc e Coupon E (See T able 7-3), mm [in] IPC-TM-650 Page 3 of 4 Number 2.6.3 Subject Moisture and Insulation Resistance, Printed Boards D…
METHOD B
IPC-TM-650
Page 2 of 4
Number
2.6.3
Subject
Moisture
and
Insulation
Resistance,
Printed
Boards
Date
05/04
Revision
F
5.1.8
Specimen
preparation
for
is
now
com¬
pleted,
continue
the
procedure
with
5.2.
5.1.9
METHOD
A
-
Application
of
Conformal
Coating.
Continuation
of
Sample
Preparation
Apply
coating
to
the
appropriate
area
of
the
test
specimen,
in
a
manner
concurrent
with
user's
production
techniques
or
as
specified
by
the
coat¬
ing
supplier.
5.1.10
After
the
application
of
coating,
the
test
specimens
are
to
be
cured,
as
specified
by
the
coating
supplier.
5.1.11
After
curing,
stabilize
to
ambient
temperature.
5.2
Test
5.2.1
Take
the
initial
insulation
resistance
measurements
at
laboratory
ambient
temperature.
Apply
the
voltage
specified
in
the
procurement
documentation
on
the
test
specimen's
test
points
as
specified
in
5.2.2
with
the
resistance
meter,
and
take
the
reading
after
measurement
stabilization.
5.2.2
Test
points
on
the
test
specimens
shall
be
connected
in
a
manner
that
will
allow
adjacent
conductor
patterns,
both
between
conductor
layers
and
on
the
same
conductor
layer,
to
alternate
between
the
positive
(+)
and
negative
(-)
terminals
of
the
power
supply
or
resistance
meter.
5.2.3
Place
test
specimens
in
chamber
in
a
vertical
position
and
under
a
condensation
drip
shield.
Connect
the
DC
volt¬
age
source
to
the
test
specimen
test
points
as
indicated
in
5.2.2.
Apply
a
1
00
±
1
0
volts
DC
polarization
voltage
to
all
test
specimens.
5.2.4
Expose
test
specimens
to
one
of
the
following
speci¬
fied
test
conditions:
(See
6.4.)
(a)
Class
1
-
35
±
5
[95
°F
±
9
°F],
85%
to
93%
rela¬
tive
humidity,
for
four
days
(static).
(b)
Class
2-50
℃
±5℃
[122
°F
±
9
°F],
85%
to
93%
rela¬
tive
humidity,
for
seven
days
(static).
(c)
Class
3-20
cycles
of
temperature
ranging
from
25
+5/-2
[77
°F
+9/-4
°F]
to
65
℃
±2℃[149
°F
±
4
°F],
85%
to
93%
relative
humidity,
1
60
hours
total.
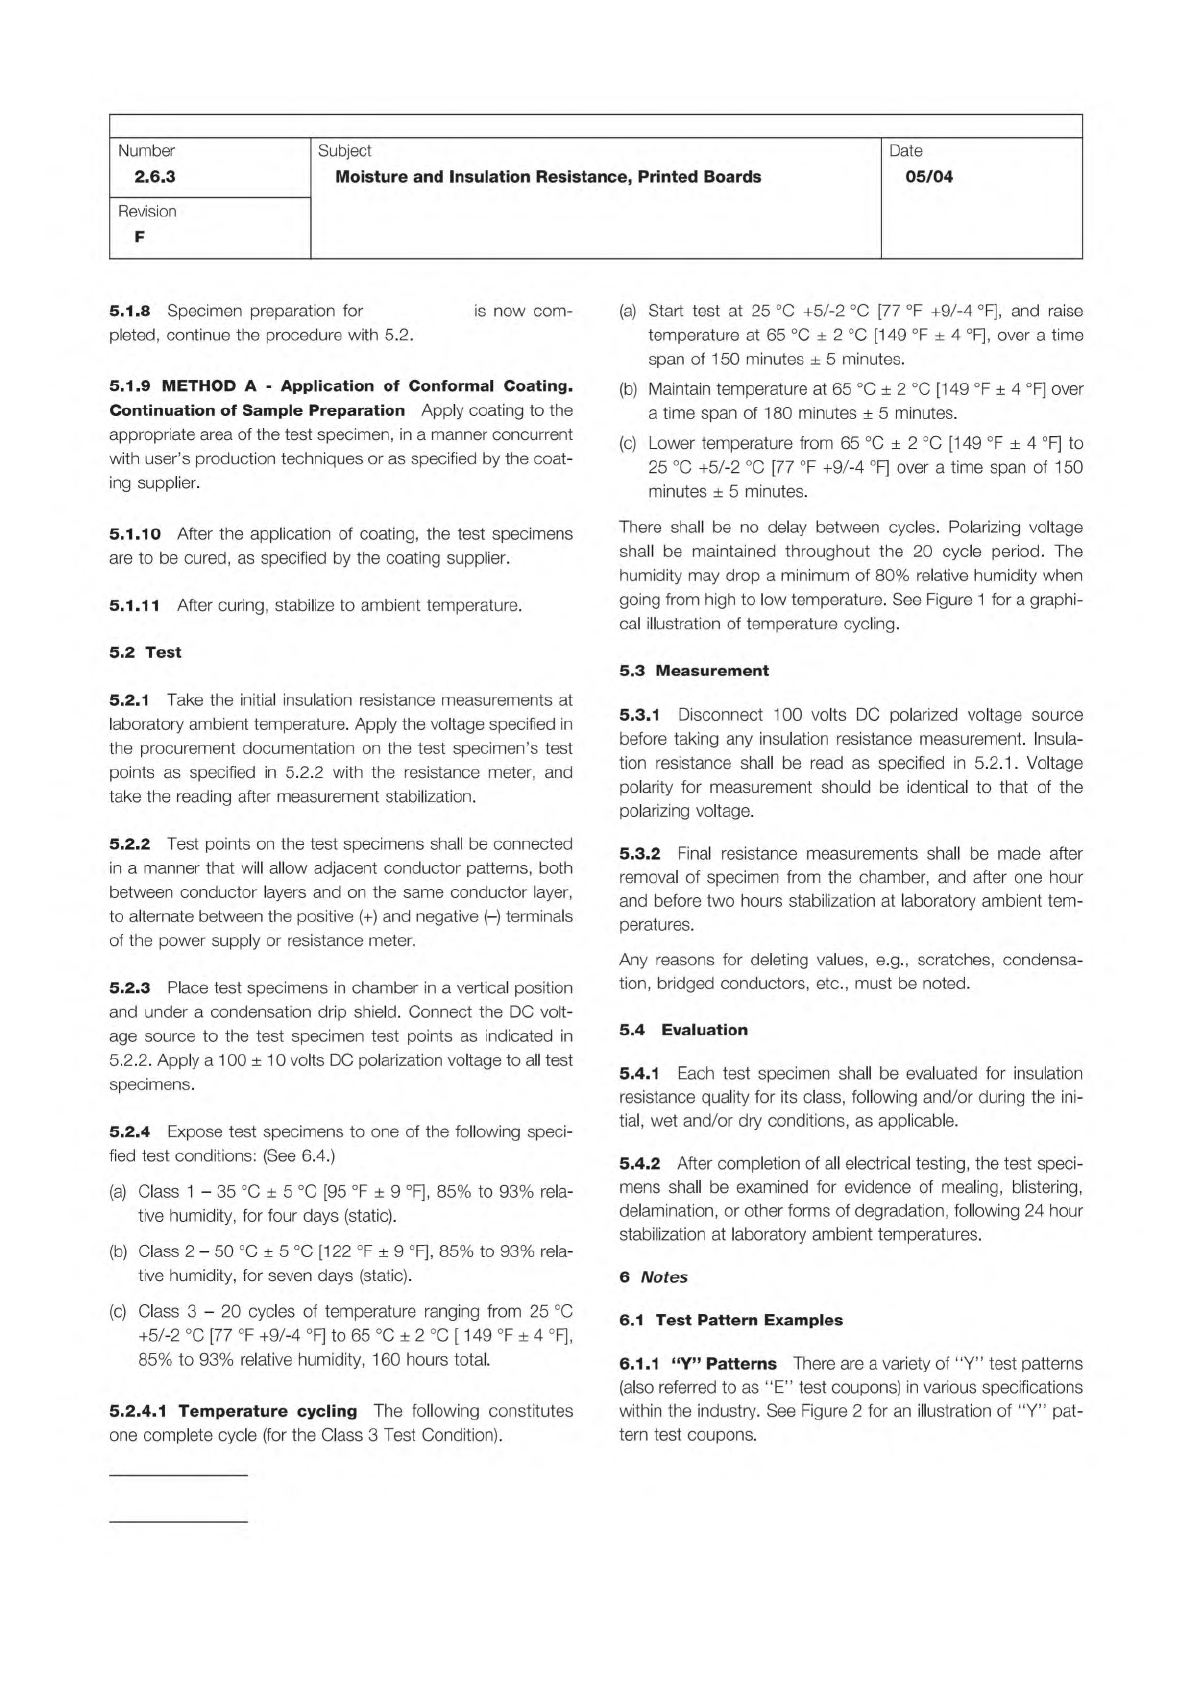
5.2.4.1
Temperature
cycling
The
following
constitutes
one
complete
cycle
(for
the
Class
3
Test
Condition).
(a)
Start
test
at
25
+5/-2
[77
°F
+9/-4
°F],
and
raise
temperature
at
65
±
2
[149
°F
±
4
°F],
over
a
time
span
of
1
50
minutes
±
5
minutes.
(b)
Maintain
temperature
at
65
±
2
[149
°F
±
4
°F]
over
a
time
span
of
1
80
minutes
土
5
minutes.
(c)
Lower
temperature
from
65
±
2
[149
°F
±
4
°F]
to
25
+5/-2
[77
°F
+9/-4
°F]
over
a
time
span
of
1
50
minutes
±
5
minutes.
There
shall
be
no
delay
between
cycles.
Polarizing
voltage
shall
be
maintained
throughout
the
20
cycle
period.
The
humidity
may
drop
a
minimum
of
80%
relative
humidity
when
going
from
high
to
low
temperature.
See
Figure
1
for
a
graphi¬
cal
illustration
of
temperature
cycling.
5.3
Measurement
5.3.1
Disconnect
100
volts
DC
polarized
voltage
source
before
taking
any
insulation
resistance
measurement.
Insula¬
tion
resistance
shall
be
read
as
specified
in
5.2.1
.
Voltage
polarity
for
measurement
should
be
identical
to
that
of
the
polarizing
voltage.
5.3.2
Final
resistance
measurements
shall
be
made
after
removal
of
specimen
from
the
chamber,
and
after
one
hour
and
before
two
hours
stabilization
at
laboratory
ambient
tem¬
peratures.
Any
reasons
for
deleting
values,
e.g.,
scratches,
condensa¬
tion,
bridged
conductors,
etc.,
must
be
noted.
5.4
Evaluation
5.4.1
Each
test
specimen
shall
be
evaluated
for
insulation
resistance
quality
for
its
class,
following
and/or
during
the
ini¬
tial,
wet
and/or
dry
conditions,
as
applicable.
5.4.2
After
completion
of
all
electrical
testing,
the
test
speci¬
mens
shall
be
examined
for
evidence
of
mealing,
blistering,
delamination,
or
other
forms
of
degradation,
following
24
hour
stabilization
at
laboratory
ambient
temperatures.
6
Notes
6.1
Test
Pattern
Examples
6.1.1
“Y”
Patterns
There
are
a
variety
of
"Y”
test
patterns
(also
referred
to
as
"E"
test
coupons)
in
various
specifications
within
the
industry.
See
Figure
2
for
an
illustration
of
“Y”
pat¬
tern
test
coupons.
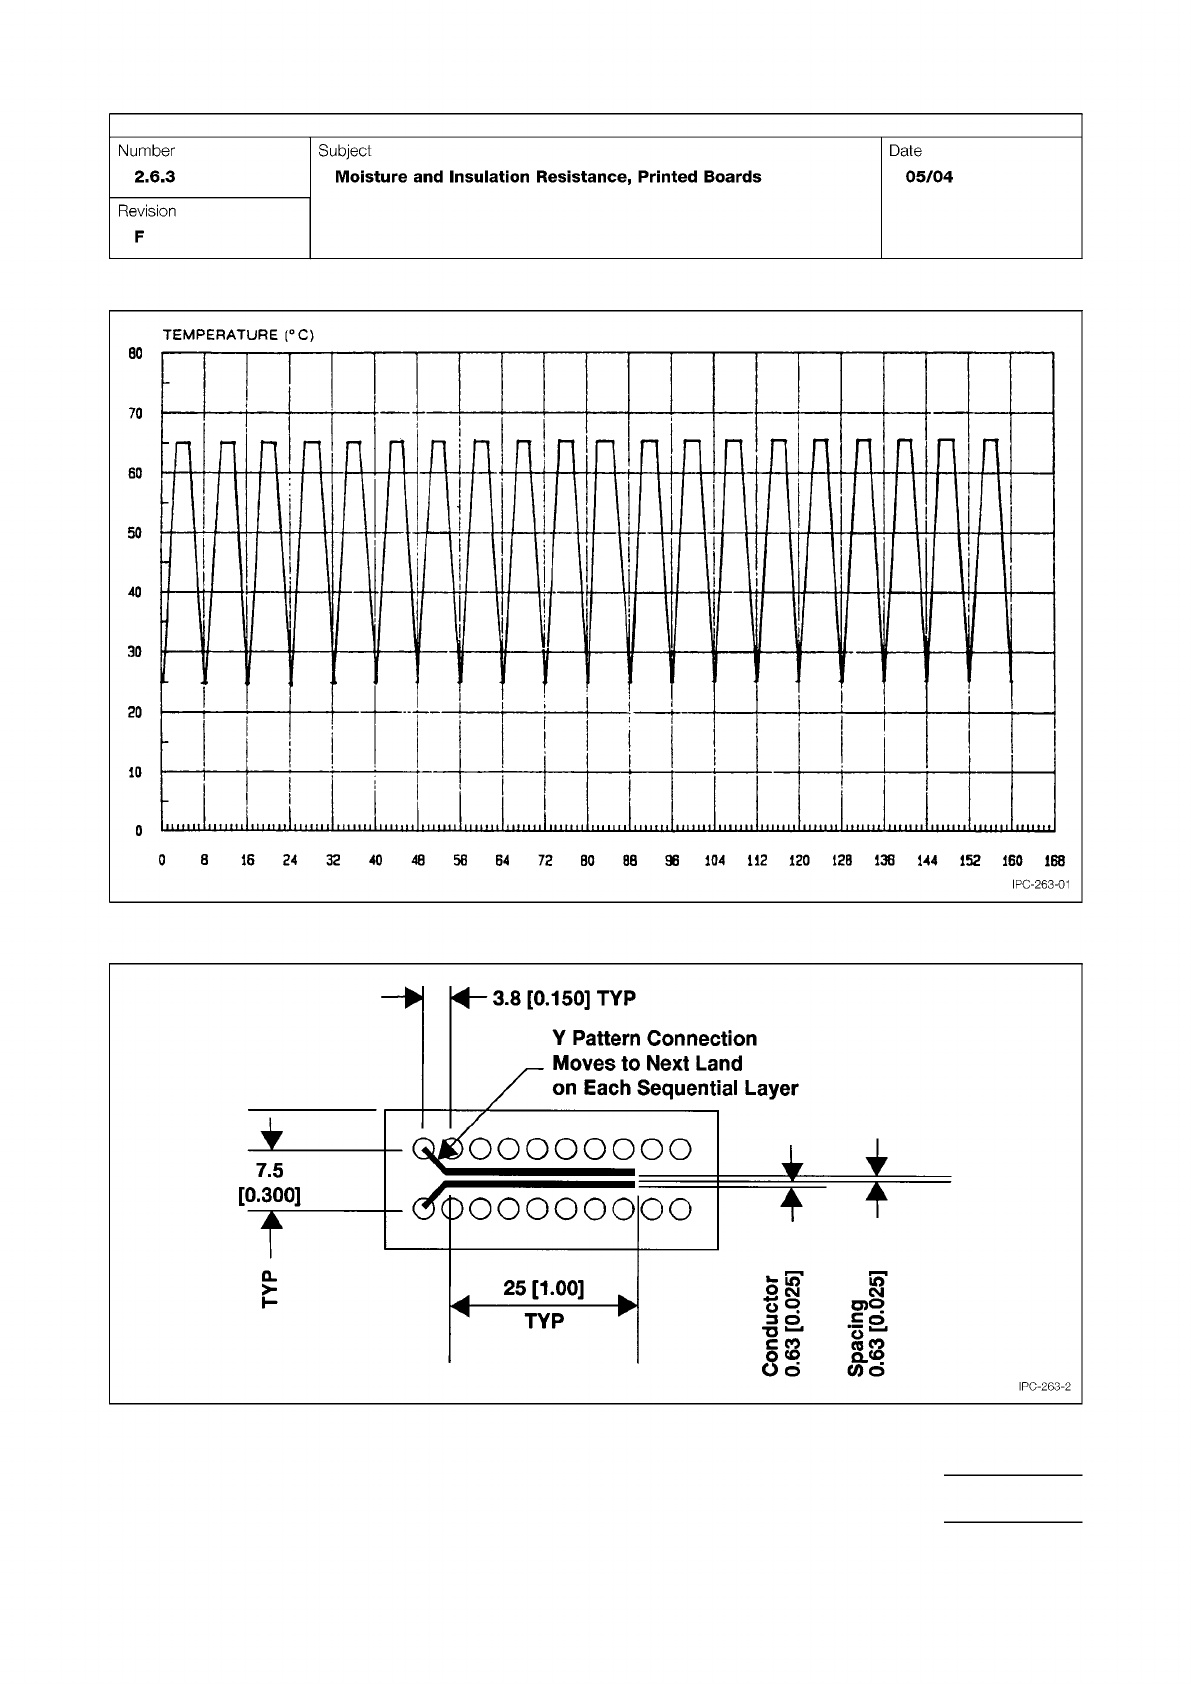
Figure 1 Moisture and Insulation Resistance Test Graph
Figure 2 Insulation Resistance Coupon E (See Table 7-3), mm [in]
IPC-TM-650
Page 3 of 4
Number
2.6.3
Subject
Moisture
and
Insulation
Resistance,
Printed
Boards
Date
05/04
Revision
F
TEMPERATURE
(
℃)
8.0
Jolonpuoo
IPC-263-2
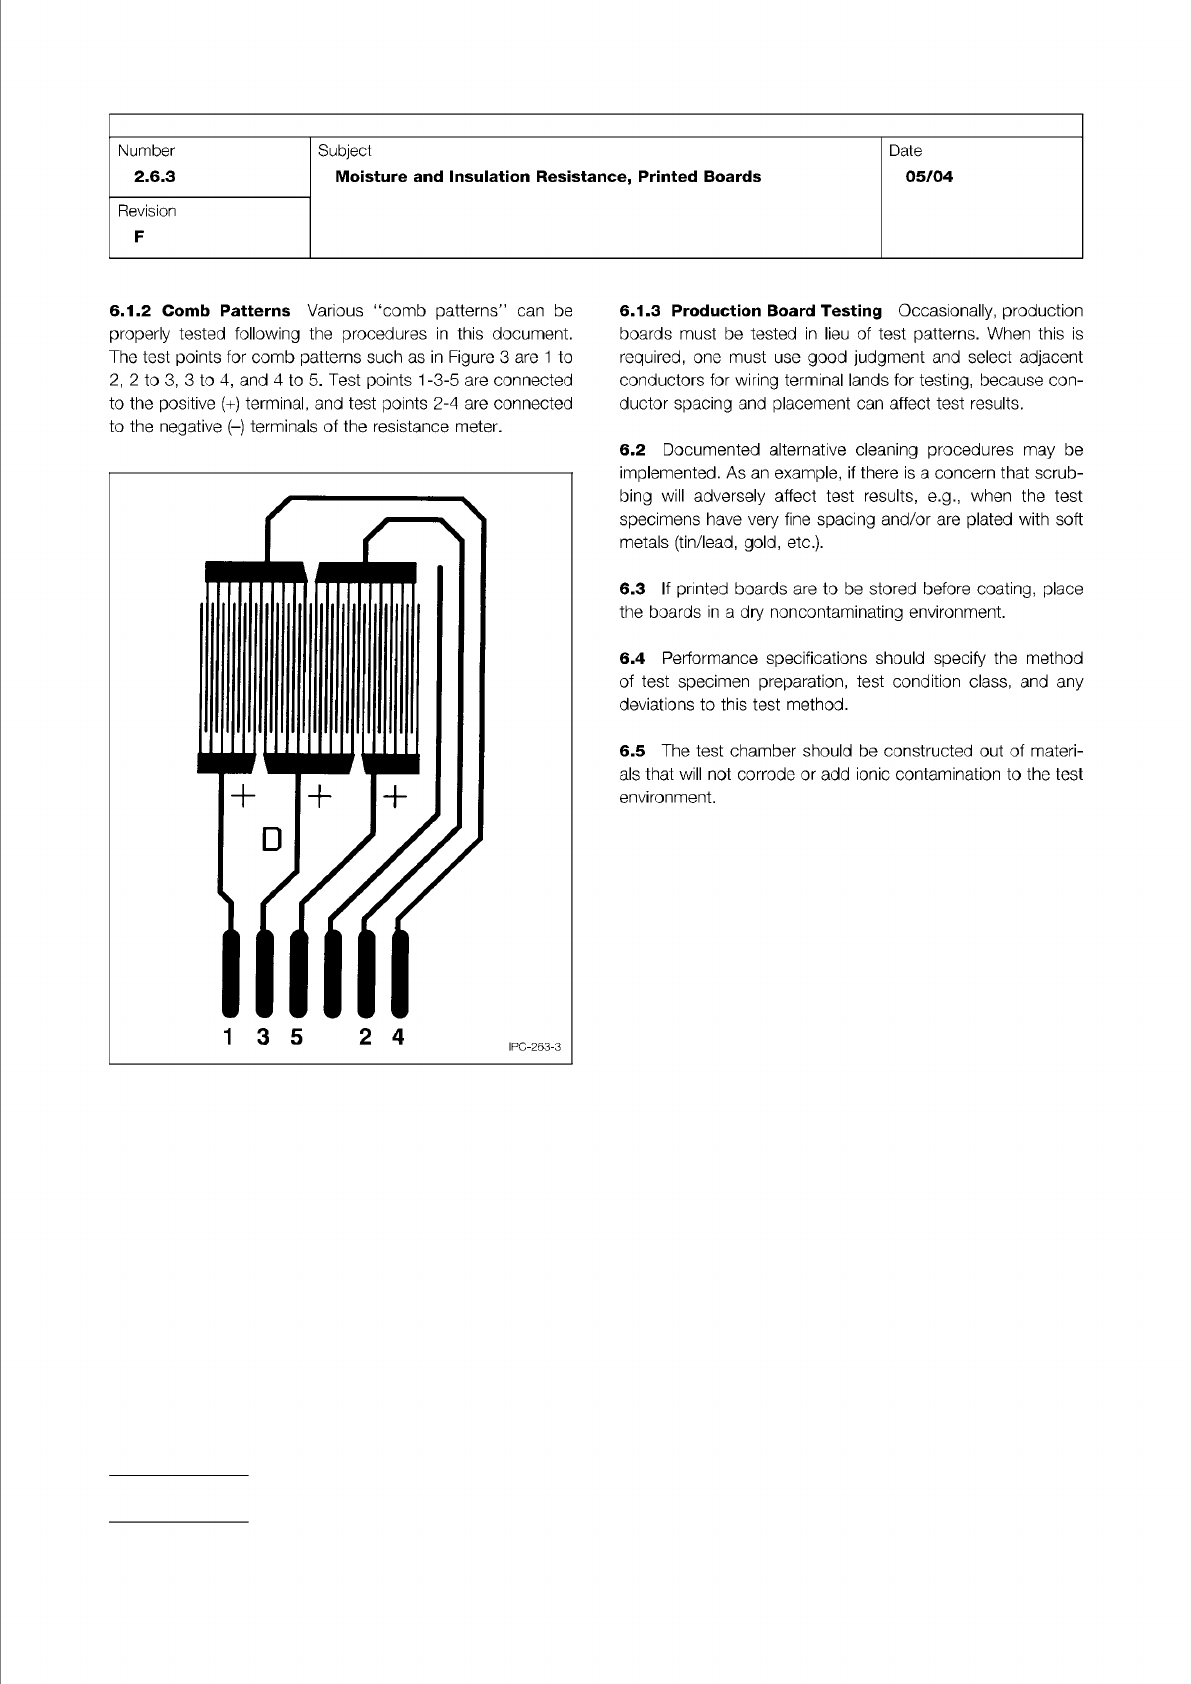
Figure 3 Typical ‘‘Comb Pattern’’ (from IPC-B-25A)
IPC-TM-650
Page 4 of 4
Number
2.6.3
Subject
Moisture
and
Insulation
Resistance,
Printed
Boards
Date
05/04
Revision
F
6.1.2
Comb
Patterns
Various
"comb
patterns"
can
be
properly
tested
following
the
procedures
in
this
document.
The
test
points
for
comb
patterns
such
as
in
Figure
3
are
1
to
2,
2
to
3,
3
to
4,
and
4
to
5.
Test
points
1-3-5
are
connected
to
the
positive
(+)
terminal,
and
test
points
2-4
are
connected
to
the
negative
(-)
terminals
of
the
resistance
meter.
6.1.3
Production
Board
Testing
Occasionally,
production
boards
must
be
tested
in
lieu
of
test
patterns.
When
this
is
required,
one
must
use
good
judgment
and
select
adjacent
conductors
for
wiring
terminal
lands
for
testing,
because
con¬
ductor
spacing
and
placement
can
affect
test
results.
6.2
Documented
alternative
cleaning
procedures
may
be
implemented.
As
an
example,
if
there
is
a
concern
that
scrub¬
bing
will
adversely
affect
test
results,
e.g.,
when
the
test
specimens
have
very
fine
spacing
and/or
are
plated
with
soft
metals
(tin/lead,
gold,
etc.).
6.3
If
printed
boards
are
to
be
stored
before
coating,
place
the
boards
in
a
dry
noncontaminating
environment.
6.4
Performance
specifications
should
specify
the
method
of
test
specimen
preparation,
test
condition
class,
and
any
deviations
to
this
test
method.
6.5
The
test
chamber
should
be
constructed
out
of
materi¬
als
that
will
not
corrode
or
add
ionic
contamination
to
the
test
environment.