IPC-TM-650 EN 2022 试验方法--.pdf - 第30页
Measurement Systems Analysis For Binary Data Test Effectiveness Calculator Version 1.0, August 2002 Introduction Welcome to the Measurement Precision Calculator. This utility is intended to perform the calculations for M…
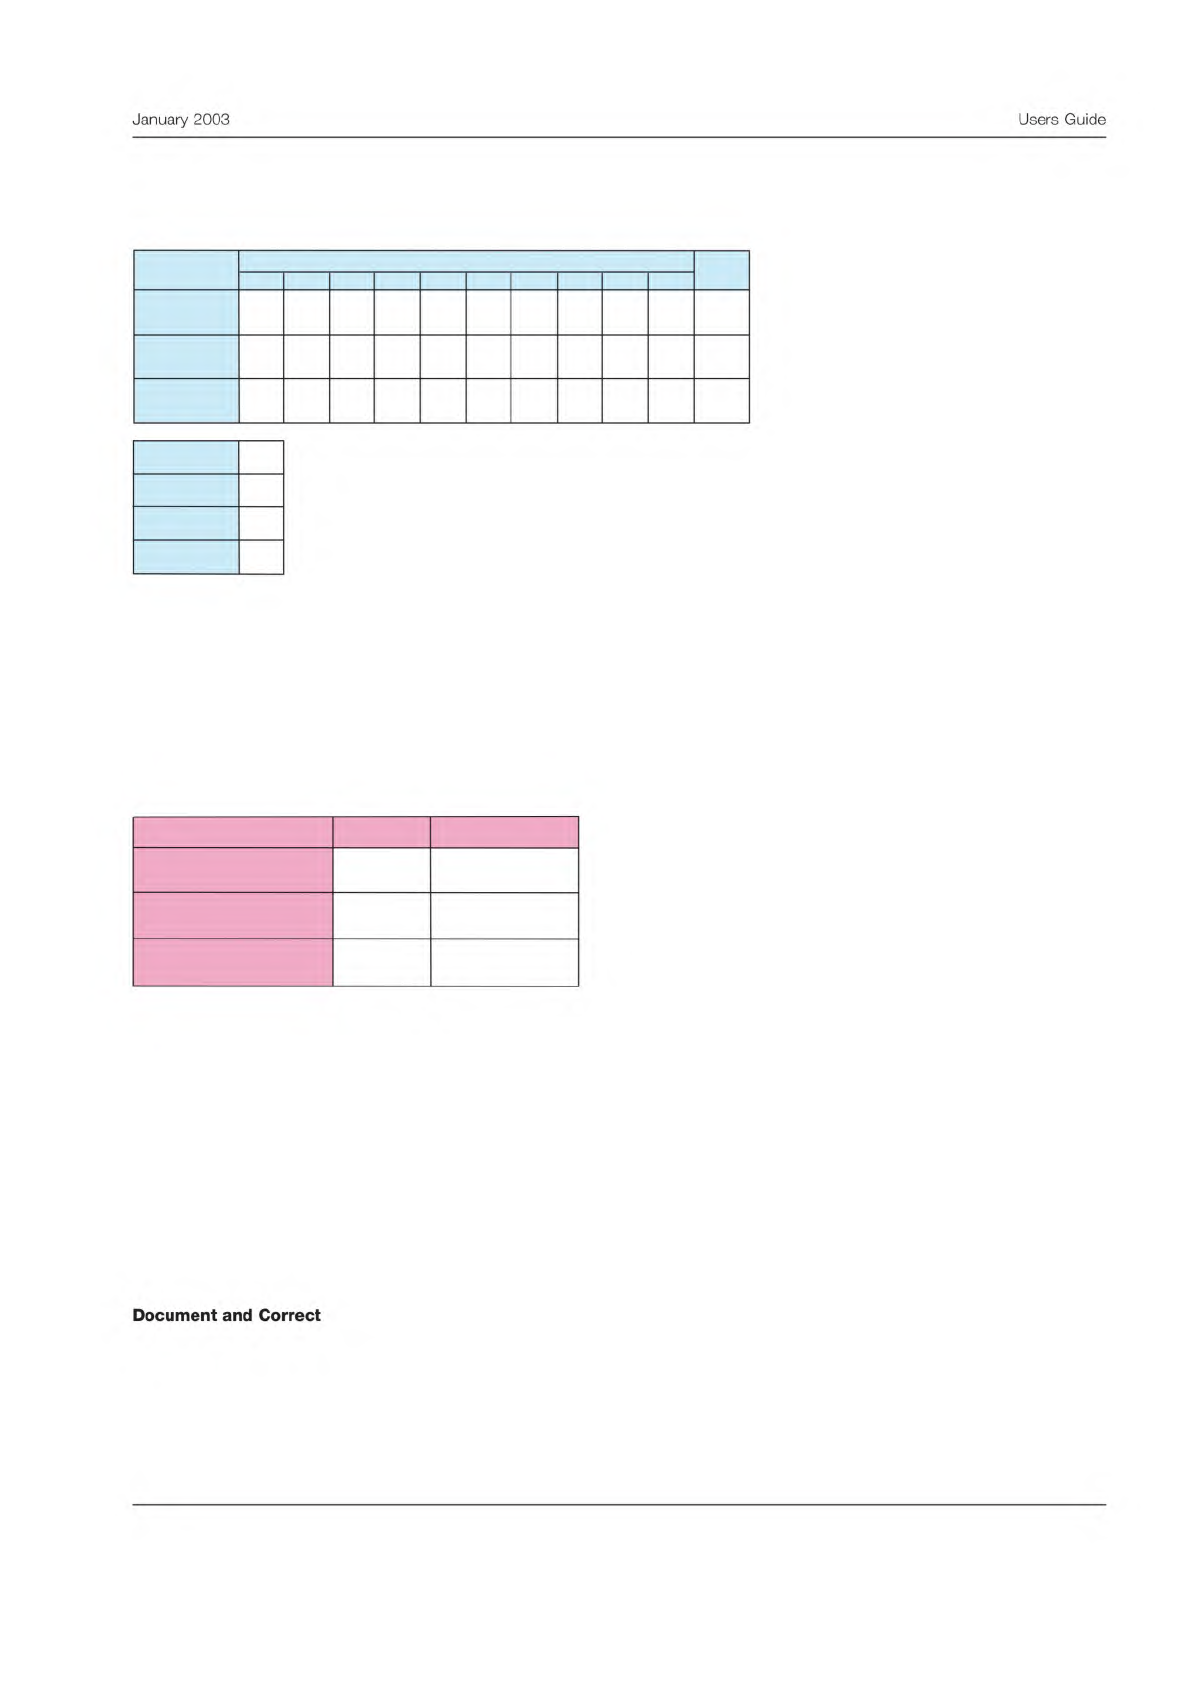
Scorecard
The final results are summarized and totaled on the scorecard.
The scorecard shows the total number of dispositions in each category for each tester. All testers are summed on the right
side on the table.
Below the scorecard is another table summarizing the number of tests performed, the number of good parts, the number of
bad parts, and the number of testers.
Test Effectiveness
The final section shows the test effectiveness calculation.
The first metric is the overall test effectiveness. This is a percentage, showing what portion of the dispositions were per-
formed correctly. A rule of thumb is that in a good test, the dispositions must be performed correctly at least 90% of the
time. Any test effectiveness less than 80% would be unacceptable. In this case the result is in the middle zone, where
improvement is recommended.
The next metric is the percent of good parts falsely rejected. In good tests, the false reject rate would be less than 5%. Any
test with a false reject rate greater than 10% needs improvement, which is the case here.
The final metric is the probability of passing bad parts. In a good test the false accept rate should be less than 2%. Any false
accept rate greater than 5% should be improved. That is the case here.
These results should be compared to the goals for the effectiveness of this inspection or test. These goals should be based
on the criticality of the outcome and probable impact of incorrect disposition.
The final step is to determine lessons learned from the MSA and document any changes to the test procedure. If the evalu-
ation indicates the test procedure needs to be improved, these improvement projects should be undertaken as soon as pos-
sible.
Measurement System Scorecard
1 2 3
4
5 6 7
8 9 10
8 7 9 0 0
0 0
0 0 0 24
2 2 1 0 0
0 0
0 0 0 5
0 1 0 0 0
0 0
0 0 0 1
30
6
4
3
Total tests
# of testers
Total
Tester
Results
Good parts
Bad parts
Dispositioned
Correctly
Good and
Rejected
Bad and
Accepted
Measurement System Effectiveness
Criteria Result Conclusion
80.0
27.8
8.3
Test effectiveness (%)
Probability of false rejects
(%)
Probability of false
acceptance (%)
Marginal
Needs improvement
Needs improvement
5
January
2003
Users
Guide
Document
and
Correct

Measurement Systems Analysis For Binary Data
Test Effectiveness Calculator
Version 1.0, August 2002
Introduction
Welcome to the Measurement Precision Calculator. This utility is intended to
perform the calculations for Measurement Precision Studies as described
in the IPC test method IPC-TM 1.8.
This unility is useful for situations where the measurement data is recorded
in binary format,, such as pass/fail or go/no-go.
Please refer to the test method before beginning the measurement precision study.
The test method defines the terms and equations used in detail.
Refer to the User Guide for further detailed instructions.
This workbook includes the following
- A blank spreadsheet to enter measurements
- A spreadsheet with example data
- A form for manual data entry, if desired.
The test data should be entered into the yellow areas on the
data entry spreadsheet. Code results as "A" and "R".
This is a beta version of this software.
Your comments and suggestions would be appreciated.
If you have any questions, please contact:
IPC-TM-650
Page 5 of 10
Number
1.9
Subject
Measurement
Precision
Estimation
for
Variables
Data
Date
01/03
Revision
A
6.3
Methods
for
Analyzing
Repeatability
and
Reproduc¬
ibility
There
are
several
methods
for
calculating
the
mea¬
surement
precision
from
the
data
obtained
during
the
mea¬
surement
precision
study.
Two
of
the
most
commonly
applied
techniques
are
applied
to
measurements
that
result
in
vari¬
ables
data,
and
are
called
the
Average
and
Range,
and
ANOVA
methods.
a.
Average
and
Range
Method
-
This
method
is
covered
in
this
test
method
and
provides
an
estimate
of
the
standard
deviation
of
the
repeatability
and
reproducibility
using
the
ranges
between
the
highest
and
lowest
measurements
in
a
subgroup.
This
method
allows
measurement
variability
to
be
decomposed
into
two
components,
repeatability
and
reproducibility.
It
does
not
estimate
the
interaction
effects.
b.
The
ANOVA
(Analysis
of
Variance)
-
This
method
uses
a
components
of
variance
technique
to
decompose
the
measurement
variability
into
various
categories,
such
as,
parts,
operators,
test
equipment,
etc.
It
can
calculate
the
interaction
between
any
of
these
components.
It
is
more
flexible,
but
is
more
challenging
to
calculate.
This
method
generally
requires
a
computer
and
a
certain
degree
of
expertise
to
interpret.
The
analysis
method
is
described
in
the
references,
see
6.4.
Measurements
which
result
in
binary
data,
such
as
go
and
no-go,
or
pass
and
fail
tests,
can
be
analyzed
for
consistency
and
correctness
of
disposition,
see
I
PC
Test
Method
IPC-TM
1.8.
In
some
cases,
the
measurement
cannot
be
repeated
more
than
once
on
the
same
sample.
This
is
common
where
the
sample
is
consumed
during
the
test,
such
as
chemical
analy¬
sis,
or
changed
during
testing,
such
as
solderability
evalua¬
tions.
In
these
cases,
the
analysis
using
a
modified
average
and
range
method
is
possible.
This
method
is
currently
under
development.
6.4
References
a.
ISO
5725-1
Accuracy
(trueness
and
precision)
of
measure¬
ment
methods
and
results
(parts
1
to
6),
1998(E),
Interna¬
tional
Organization
for
Standardization,
Geneva,
Switzer¬
land
(www.iso.org).
b.
Measurement
Systems
Analysis,
2nd
edition,
June
1998,
Automotive
Industry
Action
Group
(AIAG),
26200
Lahser
Road,
Southfield,
Ml
48034
(www.aiag.org).
c.
Standard
Practice
for
Conducting
an
Interlaboratory
Study
to
Determine
the
Precision
of
a
Test
Method,
E691
-99,
ASTM,
Philadelphia,
PA
(www.astm.org).
d.
Concepts
for
R&R
Studies,
Larry
B.
Barrentine,
(ISBN
0-87389-108-2),
ASQC
Press,
Milwaukee,
Wl
(www.quali-
typress.asq.org).
e.
Statistical
Process
Control
Guidelines,
Texas
Instruments,
Dallas,
TX
f.
Introduction
to
Statistical
Process
Control,
3rd
edition,
Douglas
C.
Montgomery,
1997,
John
Wiley
and
sons,
ISBN
0-471-30353-4,
pages
455-467
g.
Basic
Statistics,
4th
Edition,
Mark
J
Kiemele,
Stephen
R.
Schmidt,
Ronald
Berdine,
Air
Academy
Press,
1997,
ISBN
1-880156-06-7,
pages
9-71
to
9-77.
h.
“Is
100%
Test
100%
Effective,”
W.
Russell,
1998
IPO
EXPO,
San
Jose,
CA
(gives
methods
for
calculating
the
likely
outcomes
on
product
test
for
differing
levels
of
mea¬
surement
precision.)
6.5
Software
Measurement
precision
studies
are
greatly
facilitated
by
use
of
software
to
perform
the
calculations.
Below
are
just
a
few
of
the
many
software
packages
that
can
be
used
for
this
purpose.
Reference
(a)
is
an
Excel
spread¬
sheet
written
to
perform
the
calculations
in
this
procedure.
a.
Measurement
Precision
Calculator,
Excel
spreadsheet,
available
at
http://www.ipc.org/html/testmethods.htm
for
free
download.
b.
Statgraphics
Plus,
Manugistics
Corp,
2115
East
Jefferson
Street,
Rockville,
MD,
20852-4999
(
ww
w
.
statg
rap
h
i
c
-
s.com).
c.
SPG
XL,
Air
Academy
Press,
1155
Kelly
Johnson
Blvd,
Colorado
Springs,
CO
80920
(www.airacad.com).
d.
Minitab,
Minitab.
Inc.,
3081
Enterprise
Dr,
State
College,
PA
16801
(www.minitab.com).
e.
Interlaboratory
Data
Analysis
Software
for
E691,
ASTM,
100
Barr
Harbor
Dr,
West
Conshohocken,
PA
19428
(www.astm.org).