IPC-TM-650 EN 2022 试验方法--.pdf - 第46页
Because macros were avoided, the messy details of the calculations appear in t he next s ection. If they make one n er vous, just hide t hem, and go directly to the Sc orecard. One ma y , however , find these calculations…
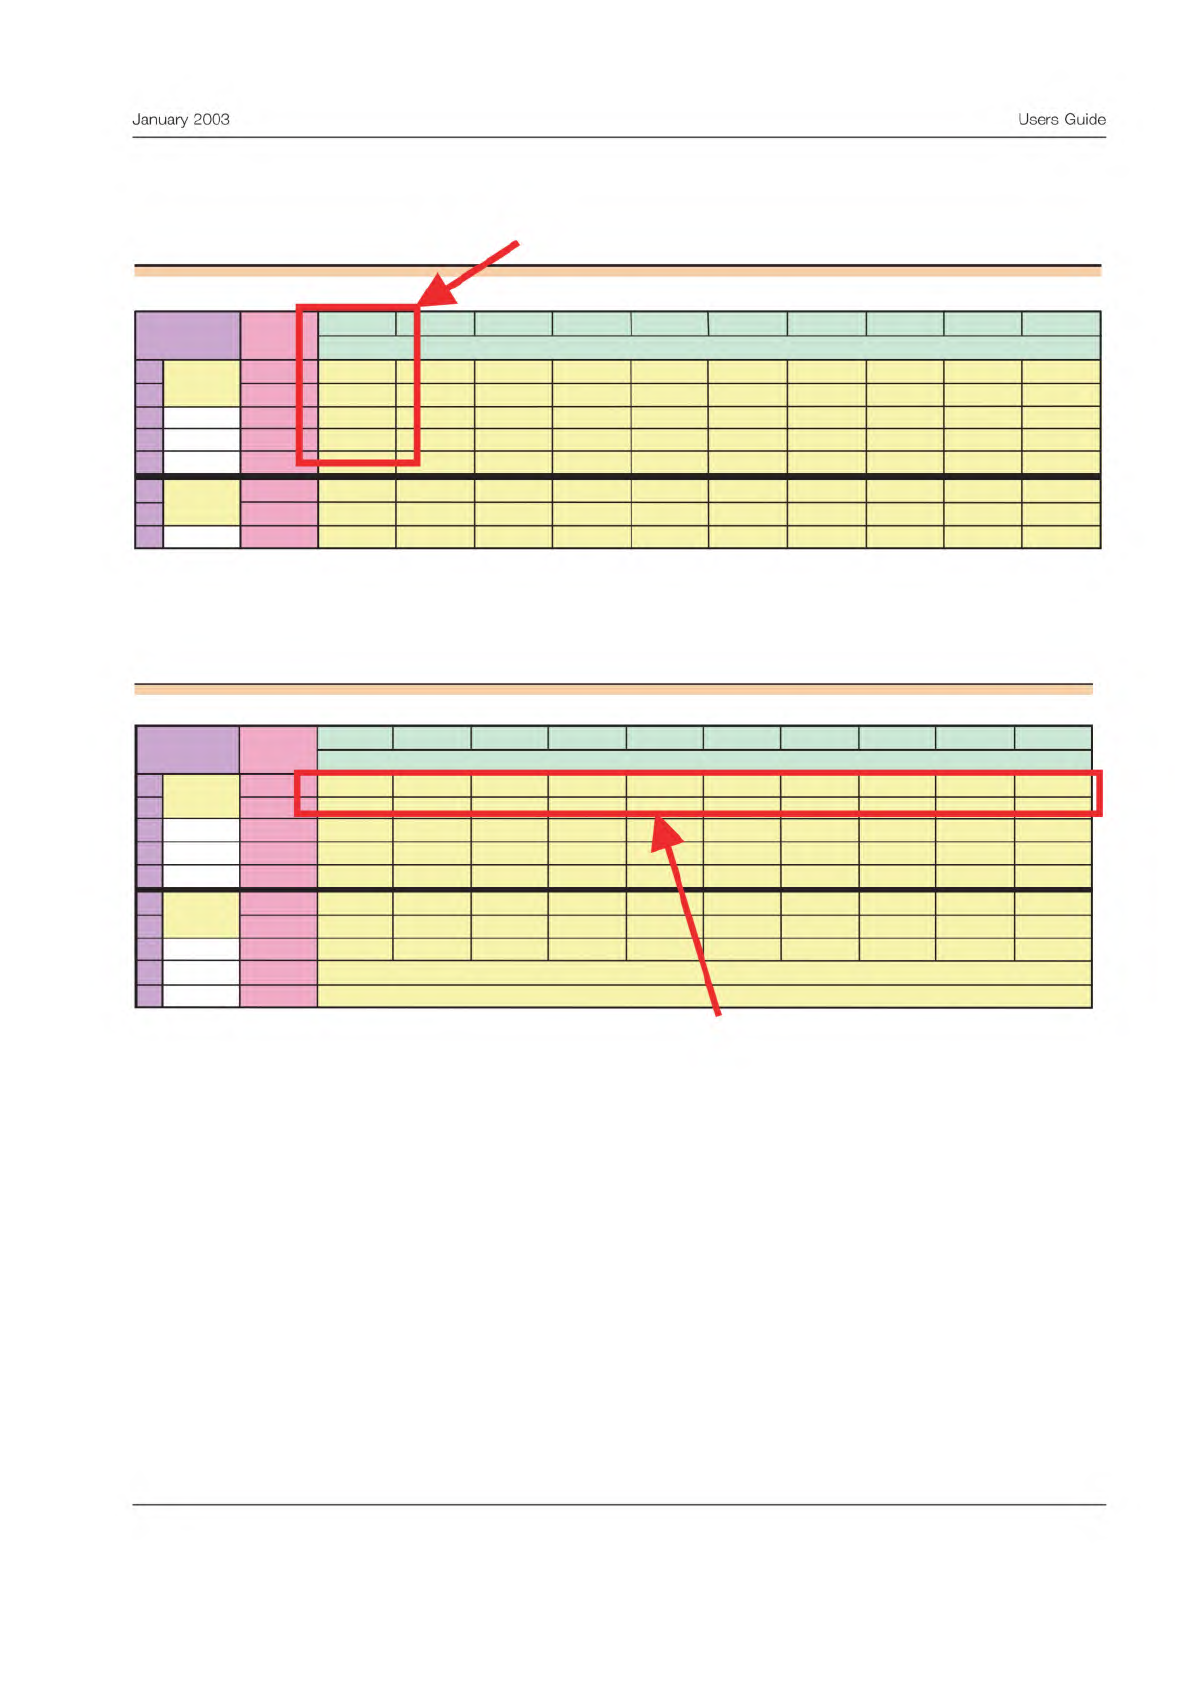
Within the section for a given test condition, the repeated readings for each part are entered in columns, as shown below.
Therefore each row within the test condition area represents one complete set of readings for one test round for that tester.
Measurement Precision Study: Data Entry Sheet
Sample
Sample
Sample Sample
Sample
Sample
Sample
Sample
Sample
Sample
1 2
3
4
5
6
7 8
9
10
1 1 0.62 0.99 0.82 0.85
0.59 1.02 0.97 0.85 1
0.61
2 0.66 1 0.81 0.89
0.48 1.03 0.97 0.82
1 0.7
3
4
5
2
1 0.53 1.05 0.8 0.83 0.39 1.04 0.97 0.73
0.98 0.54
2 0.53 0.93 0.77 0.76 0.4 1.08 0.91 0.7
0.95
0.6
3
Condition
Station 1
Station 2
Reading
Data for on
test sample
Measurement Precision Study: Data Entry Sheet
Sample
Sample
Sample
Sample
Sample
Sample
Sample Sample Sample Sample
1 2 3 4
5
6
7 8
9
10
1 1 0.62 0.99 0.82 0.85 0.59 1.02 0.97 0.85 1 0.61
2 0.66 1 0.81
0.89
0.48
1.03
0.97 0.82 1
0.7
3
4
5
2 1 0.53 1.05 0.8 0.83
0.39
1.04 0.97 0.73 0.98 0.54
2
0.53 0.93 0.77 0.76 0.4
1.08
0.91 0.7 0.95 0.6
3
4
5
Condition
Station 1
Station 2
Reading
First round of measurements on
all samples for one test condition
5
January
2003
Users
Guide
Because macros were avoided, the messy details of the calculations appear in the next section. If they make one nervous,
just hide them, and go directly to the Scorecard. One may, however, find these calculations helpful. Here is how this sec-
tion is organized:
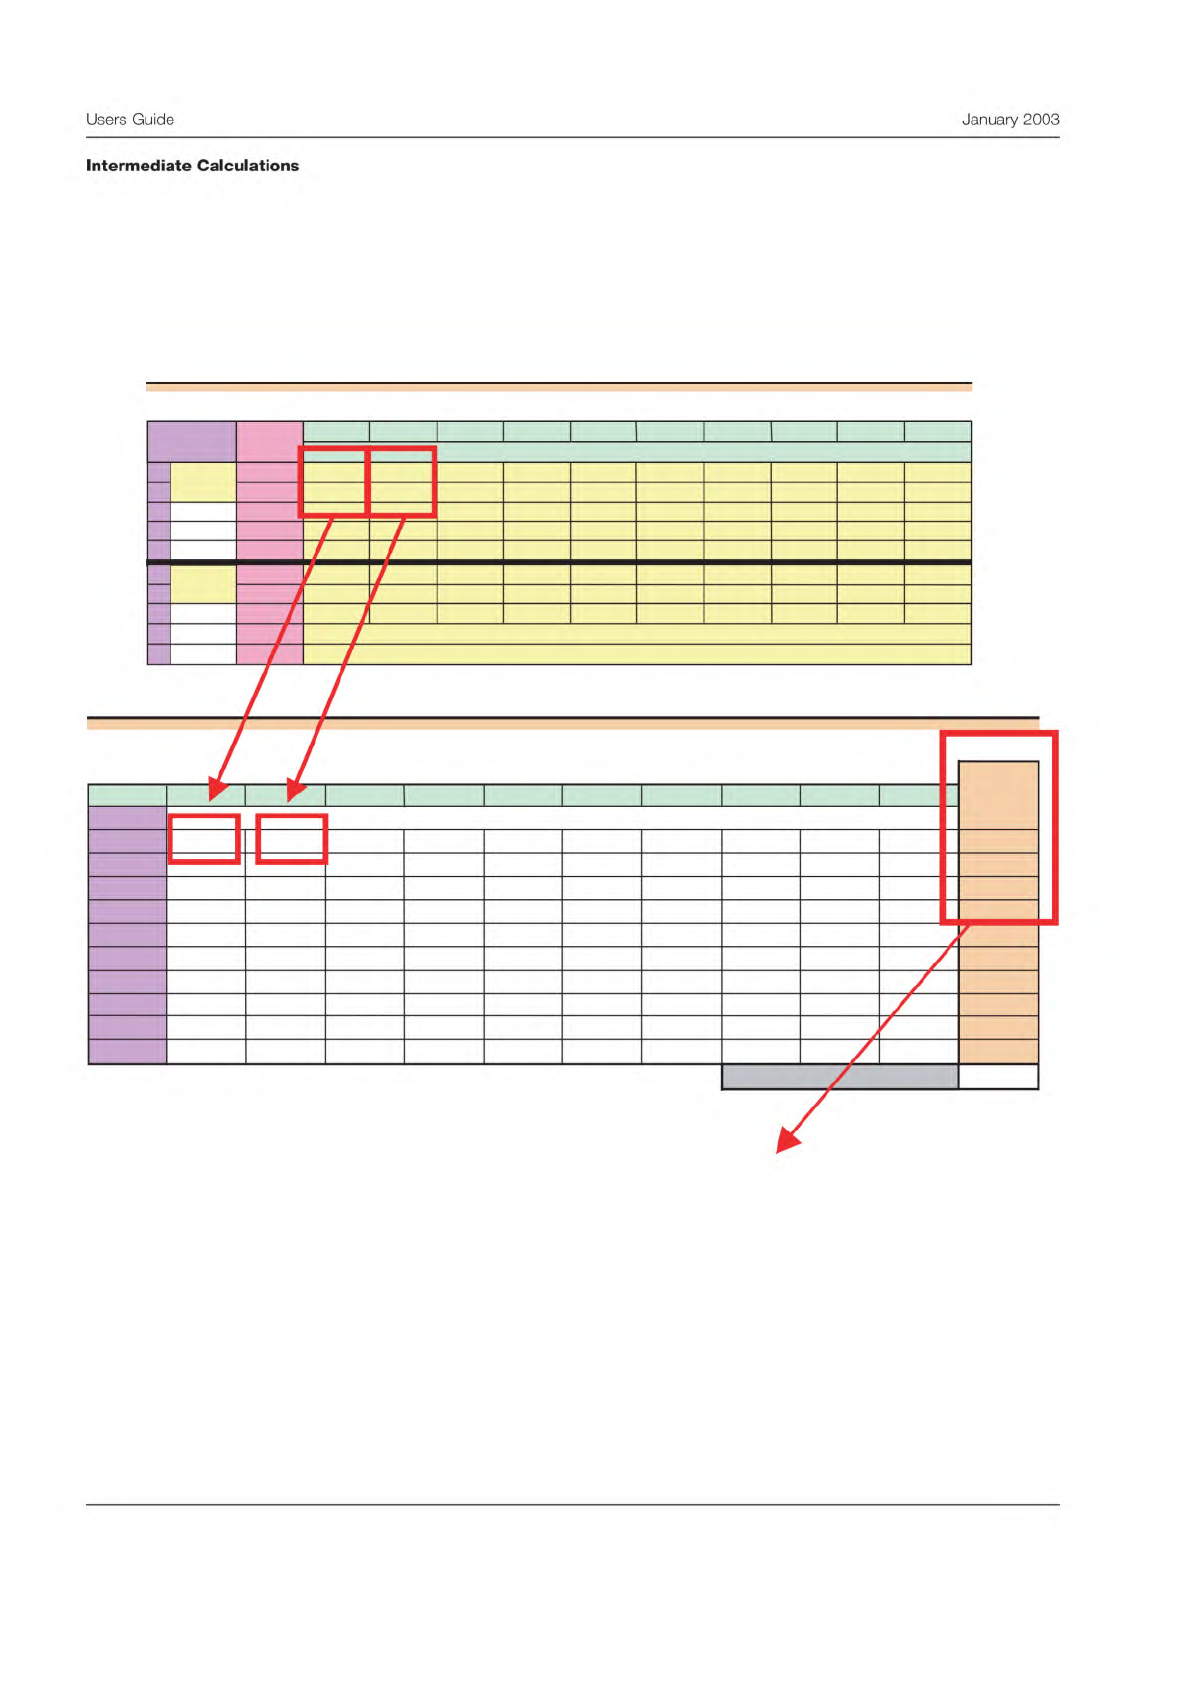
The first table in the calculations section shows the average reading for each part for each tester. Be sure and note the color-
coding scheme to keep track of the headings in the table. Headings pertaining to test conditions appear in purple. Headings
for samples appear in yellow.
Measurement Precision Study: Calculation Sheet
Ranges:
Average
Condition
Ranges
Sample 1 2 3 4 5 6 7 8 9 10
Condition
1 0.04 0.01 0.01 0.04 0.11 0.01 0 0.03 0
0.09 0.034
2 0 0.12 0.03 0.07 0.01 0.04 0.06
0.03 0.03 0.06 0.045
3 0.04 0.03 0.03 0.02 0.04 0.04 0
0.01 0.01 0.03 0.025
4 0
5 0
6 0
7 0
8 0
9 0
10 0
Average of the range averages
0.03467
Measurement Precision Study: Data Entry Sheet
Sample Sample Sample Sample Sample Sample Sample Sample Sample Sample
1 2 3 4 5 6 7 8 9 10
1 1 0.62 0.99 0.82 0.85 0.59 1.02 0.97 0.85 1 0.61
2 0.66 1 0.81 0.89 0.48 1.03 0.97 0.82 1 0.7
3
4
5
2 1 0.53 1.05 0.8 0.83 0.39 1.04 0.97 0.73 0.98 0.54
2 0.53 0.93 0.77 0.76 0.4 1.08 0.7 0.95 0.6
3
4
5
Condition
Station 1
Station 2
Reading
The right column in the table above shows the range for that test condition. The range is
the difference between the maximum and minimum measurement average.
6
Users
Guide
January
2003
Intermediate
Calculations
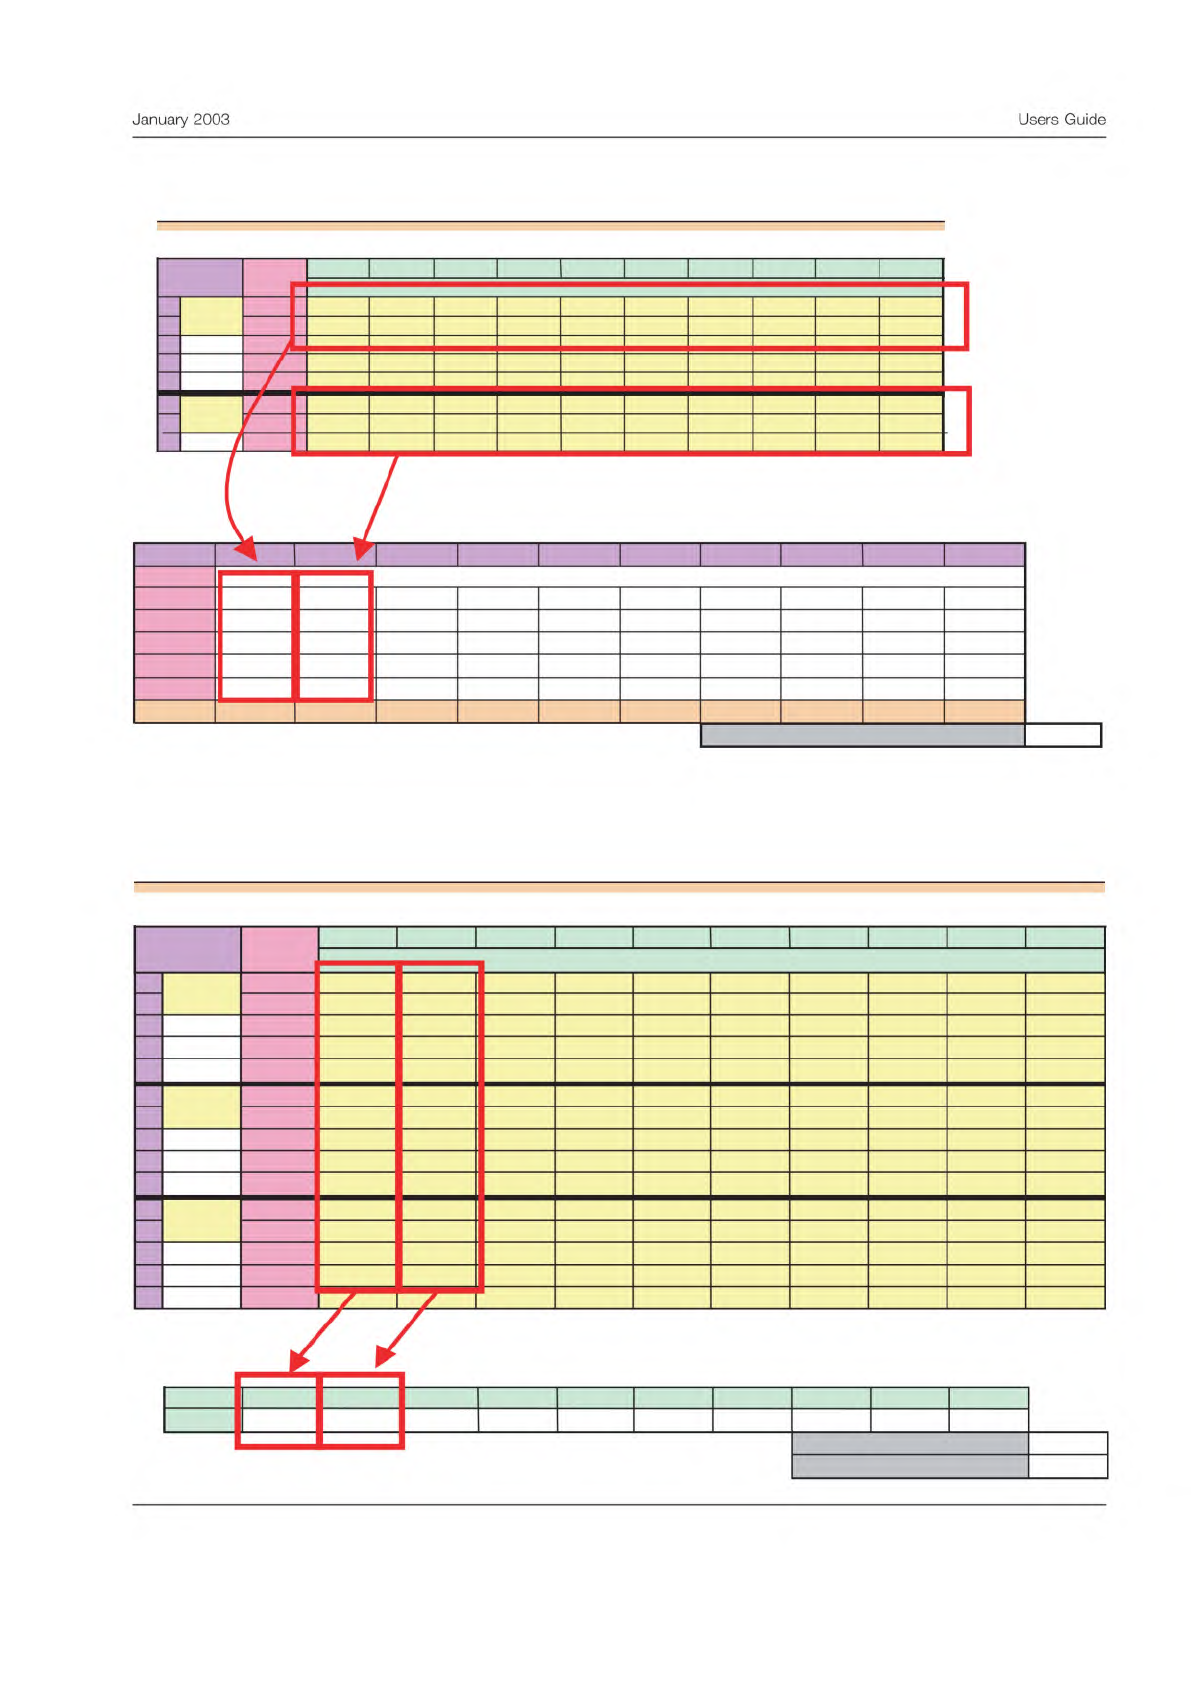
The next calculation table shows, for each test condition, the average of all sample measurements for each repetition.
The final table shows the overall average of all repetitions of all measurements across all test conditions.
Averages:
Condition
1 2 3 4 5 6 7 8 9 10
Readings
Set 1 0.83200 0.786 0.825
Set 2 0.836 0.763 0.832
Set 3
Set 4
Set 5
Op Avg 0.834 0.7745 0.8285
Absolute difference of condition averages
0.0595
Measurement Precision Study: Data Entry Sheet
Sample Sample Sample Sample Sample Sample Sample Sample Sample Sample
1 2 3 4 5 6 7 8 9 10
1 1 0.62 0.99 0.82 0.85 0.59 1.02 0.97 0.85 1 0.61
2 0.66 1 0.81 0.89 0.48
1.03 0.97 0.82 1 0.7
3
4
5
2 1 0.53 1.05 0.8 0.83 0.39 1.04 0.97
0.73
0.98 0.54
2 0.53 0.93 0.77 0.76 0.4 1.08 0.91
0.7 0.95 0.6
3
Condition
Station 1
Station 2
Reading
Average of each set of readings for each test condition
Sample 1 2 3 4 5 6
7
8 9
10
Avg 0.56667
1.00667 0.795
0.82167
0.46667
1.03833
0.95667 0.785
1.00333
0.68333
Average of sample averages
0.81233
Range of sample averages
0.57167
Measurement Precision Study: Data Entry Sheet
Sample Sample Sample Sample
Sample Sample Sample Sample Sample Sample
1 2 3 4 5 6 7 8 9 10
1 1 0.62 0.99 0.82 0.85 0.59 1.02
0.97 0.85
1 0.61
2
0.66 1 0.81 0.89 0.48 1.03 0.97 0.82 1 0.7
3
4
5
2
1 0.53 1.05 0.8 0.83 0.39 1.04
0.97 0.73
0.98
0.54
2 0.53 0.93 0.77 0.76 0.4 1.08
0.91 0.7 0.95
0.6
3
4
5
3 1 0.51 1.05 0.8 0.79
0.45 1.01 0.96 0.8 1.04
0.84
2 0.55 1.02 0.77
0.81
0.49 1.05 0.96 0.81 1.05
0.81
3
4
5
Condition
Station 3
Station 1
Station 2
Reading
Average of all readings
For each sample
7
January
2003
Users
Guide
—
/
—
%
/