IPC-TM-650 EN 2022 试验方法--.pdf - 第47页
The ne xt calculation table shows, for each test condition, the average of all sample measurements for each repetition. The final table shows the overall average of all repetitions of all measurements across all test cond…
Because macros were avoided, the messy details of the calculations appear in the next section. If they make one nervous,
just hide them, and go directly to the Scorecard. One may, however, find these calculations helpful. Here is how this sec-
tion is organized:
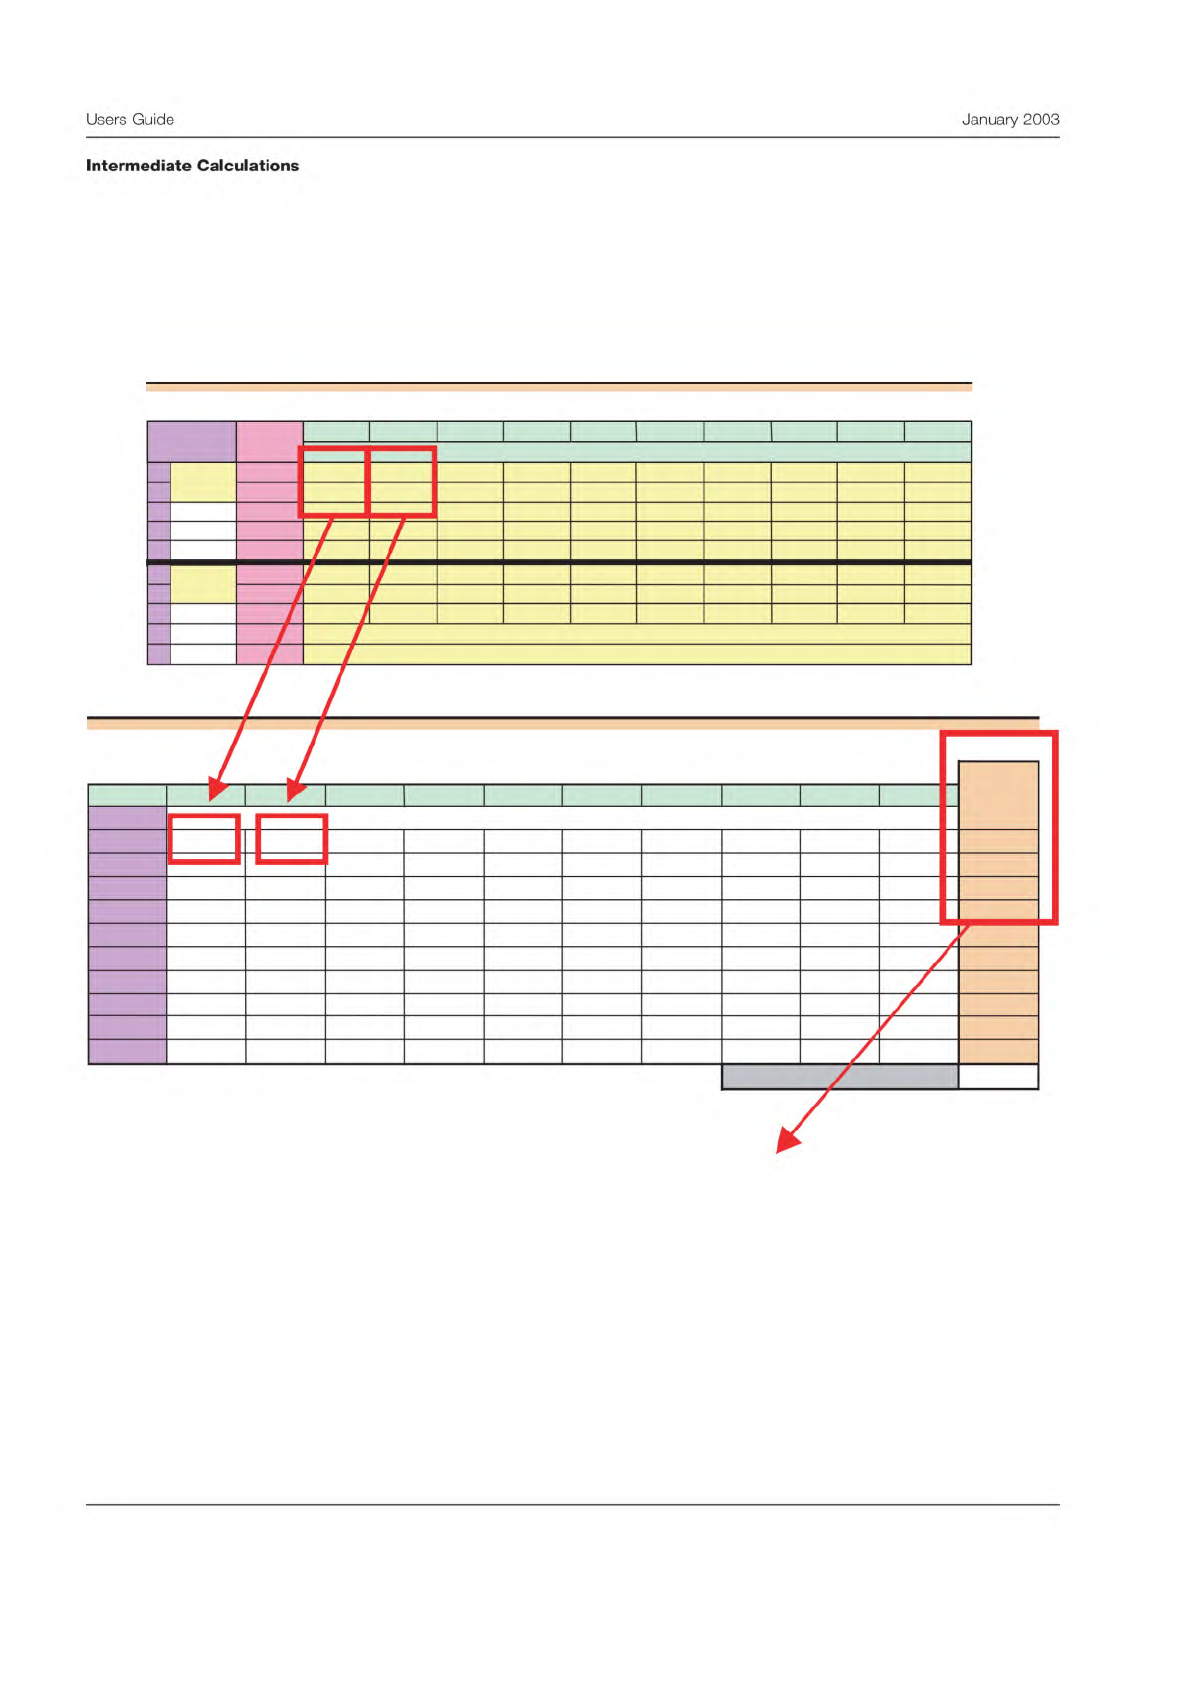
The first table in the calculations section shows the average reading for each part for each tester. Be sure and note the color-
coding scheme to keep track of the headings in the table. Headings pertaining to test conditions appear in purple. Headings
for samples appear in yellow.
Measurement Precision Study: Calculation Sheet
Ranges:
Average
Condition
Ranges
Sample 1 2 3 4 5 6 7 8 9 10
Condition
1 0.04 0.01 0.01 0.04 0.11 0.01 0 0.03 0
0.09 0.034
2 0 0.12 0.03 0.07 0.01 0.04 0.06
0.03 0.03 0.06 0.045
3 0.04 0.03 0.03 0.02 0.04 0.04 0
0.01 0.01 0.03 0.025
4 0
5 0
6 0
7 0
8 0
9 0
10 0
Average of the range averages
0.03467
Measurement Precision Study: Data Entry Sheet
Sample Sample Sample Sample Sample Sample Sample Sample Sample Sample
1 2 3 4 5 6 7 8 9 10
1 1 0.62 0.99 0.82 0.85 0.59 1.02 0.97 0.85 1 0.61
2 0.66 1 0.81 0.89 0.48 1.03 0.97 0.82 1 0.7
3
4
5
2 1 0.53 1.05 0.8 0.83 0.39 1.04 0.97 0.73 0.98 0.54
2 0.53 0.93 0.77 0.76 0.4 1.08 0.7 0.95 0.6
3
4
5
Condition
Station 1
Station 2
Reading
The right column in the table above shows the range for that test condition. The range is
the difference between the maximum and minimum measurement average.
6
Users
Guide
January
2003
Intermediate
Calculations
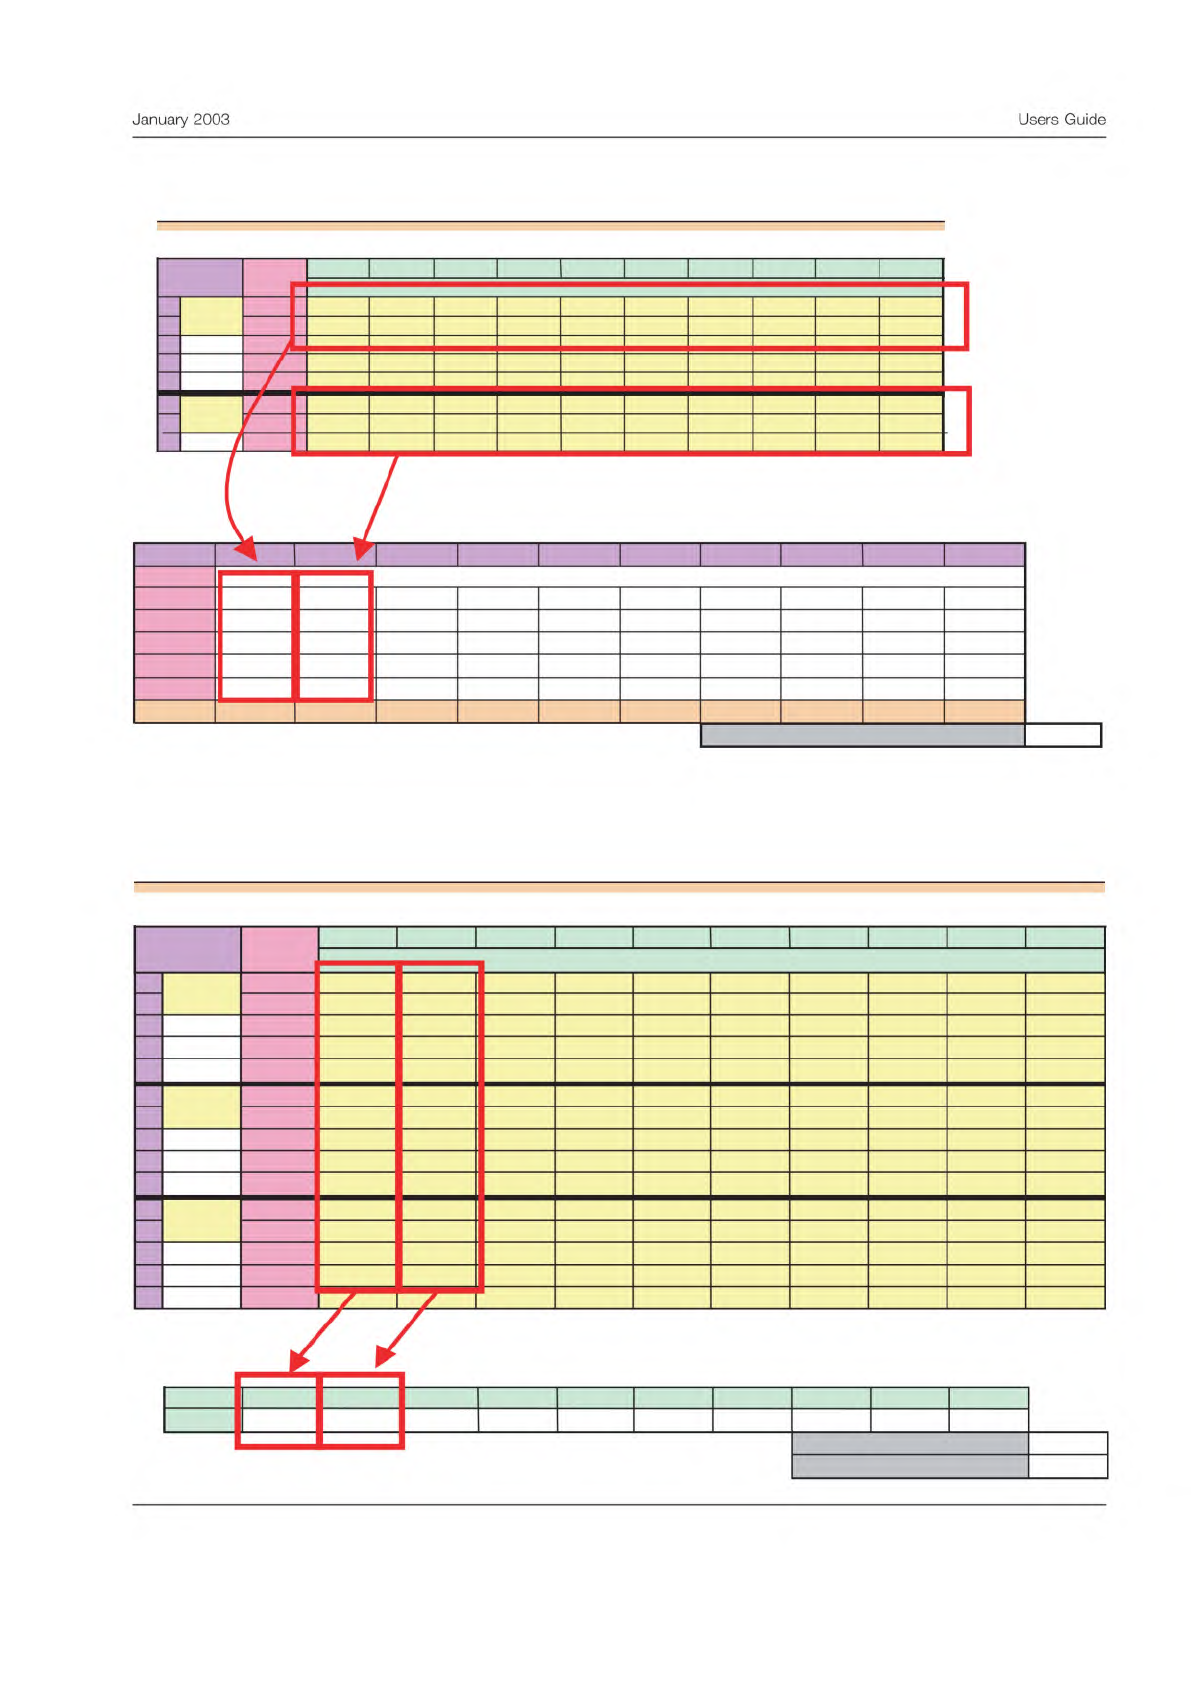
The next calculation table shows, for each test condition, the average of all sample measurements for each repetition.
The final table shows the overall average of all repetitions of all measurements across all test conditions.
Averages:
Condition
1 2 3 4 5 6 7 8 9 10
Readings
Set 1 0.83200 0.786 0.825
Set 2 0.836 0.763 0.832
Set 3
Set 4
Set 5
Op Avg 0.834 0.7745 0.8285
Absolute difference of condition averages
0.0595
Measurement Precision Study: Data Entry Sheet
Sample Sample Sample Sample Sample Sample Sample Sample Sample Sample
1 2 3 4 5 6 7 8 9 10
1 1 0.62 0.99 0.82 0.85 0.59 1.02 0.97 0.85 1 0.61
2 0.66 1 0.81 0.89 0.48
1.03 0.97 0.82 1 0.7
3
4
5
2 1 0.53 1.05 0.8 0.83 0.39 1.04 0.97
0.73
0.98 0.54
2 0.53 0.93 0.77 0.76 0.4 1.08 0.91
0.7 0.95 0.6
3
Condition
Station 1
Station 2
Reading
Average of each set of readings for each test condition
Sample 1 2 3 4 5 6
7
8 9
10
Avg 0.56667
1.00667 0.795
0.82167
0.46667
1.03833
0.95667 0.785
1.00333
0.68333
Average of sample averages
0.81233
Range of sample averages
0.57167
Measurement Precision Study: Data Entry Sheet
Sample Sample Sample Sample
Sample Sample Sample Sample Sample Sample
1 2 3 4 5 6 7 8 9 10
1 1 0.62 0.99 0.82 0.85 0.59 1.02
0.97 0.85
1 0.61
2
0.66 1 0.81 0.89 0.48 1.03 0.97 0.82 1 0.7
3
4
5
2
1 0.53 1.05 0.8 0.83 0.39 1.04
0.97 0.73
0.98
0.54
2 0.53 0.93 0.77 0.76 0.4 1.08
0.91 0.7 0.95
0.6
3
4
5
3 1 0.51 1.05 0.8 0.79
0.45 1.01 0.96 0.8 1.04
0.84
2 0.55 1.02 0.77
0.81
0.49 1.05 0.96 0.81 1.05
0.81
3
4
5
Condition
Station 3
Station 1
Station 2
Reading
Average of all readings
For each sample
7
January
2003
Users
Guide
—
/
—
%
/
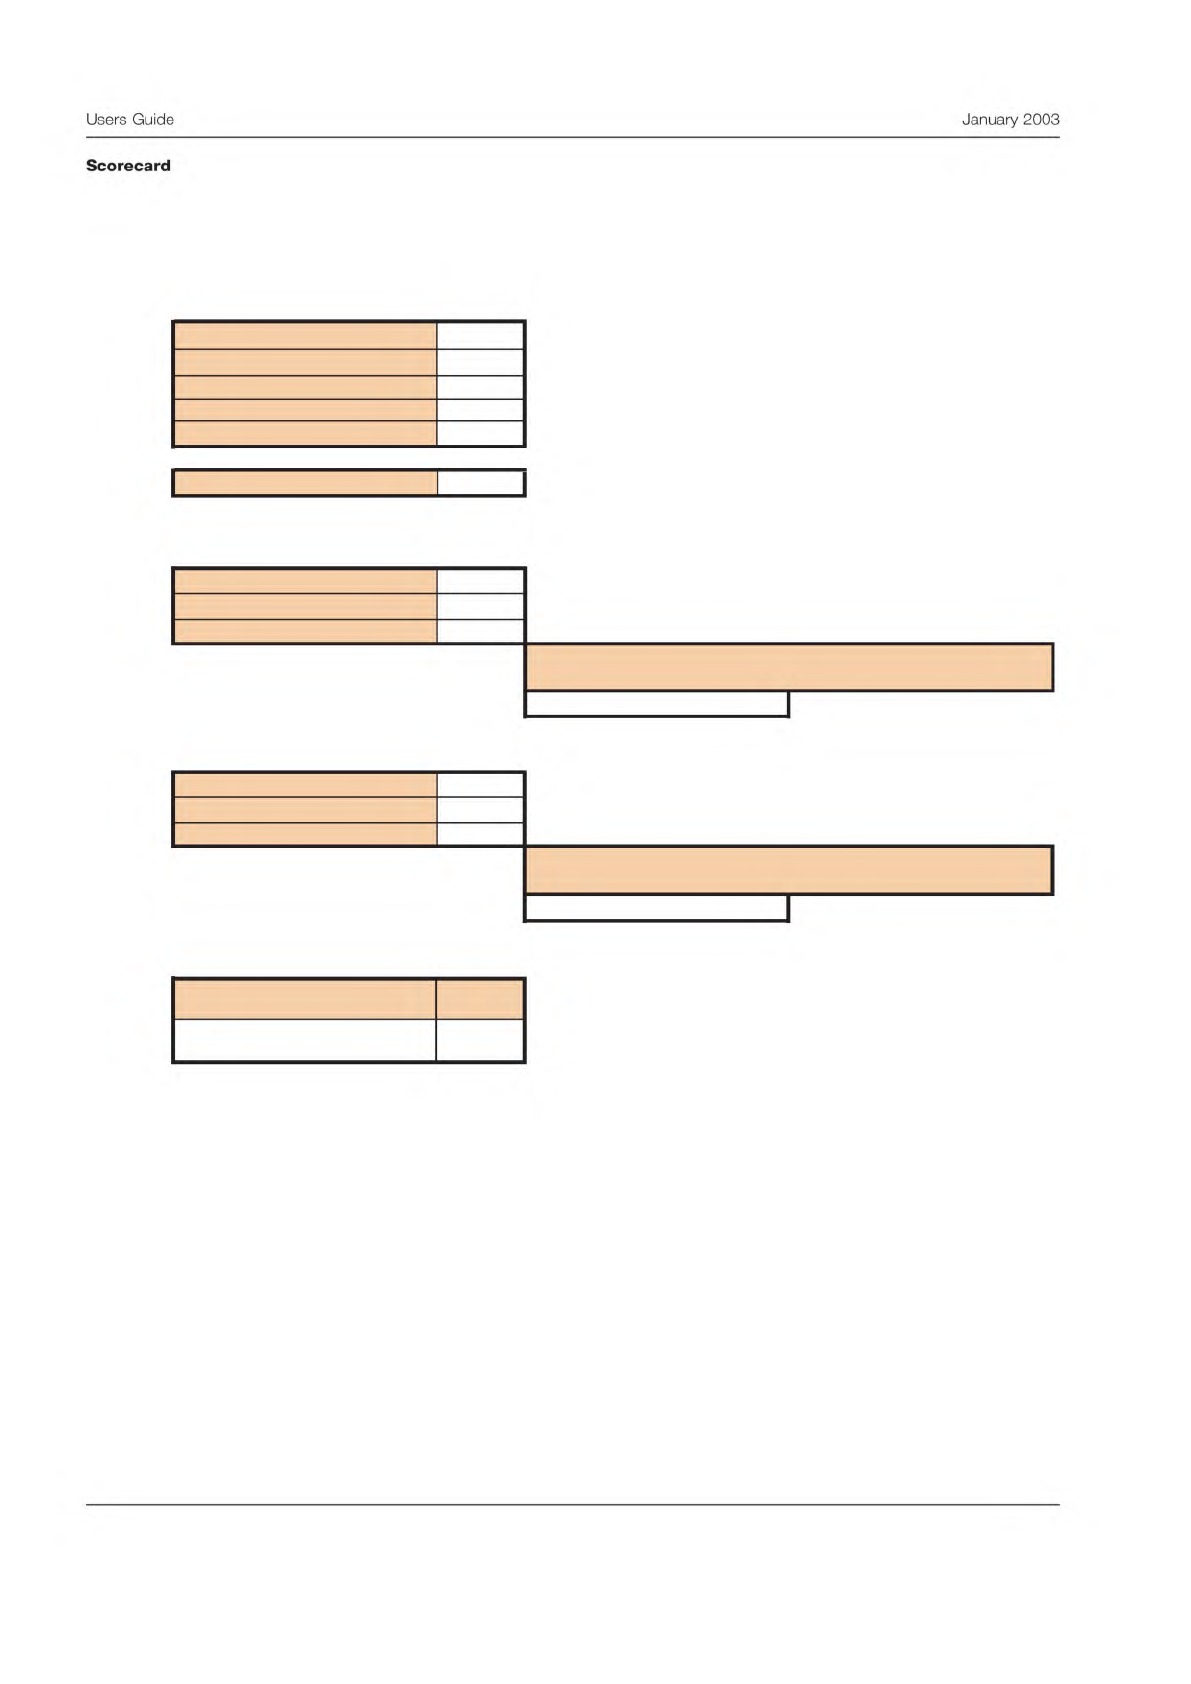
The scorecard shows four different sets of calculations. This array of calculations reflects different approaches many find
useful.
The first section shows a summary of the variability calculations. The table shows calculated standard deviations. Starting
at the bottom, the table shows the total observed variation. Next the total variation is split into two portions, the process
variation and the total measurement variation, called measurement R&r. Process variation reflects differences in product per-
formance. The measurement variation reflects just differences in the measurement of this performance. The top two numbers
split the measurement variation into two portions, repeatability and reproducibility. The repeatability refers to variation
within a test condition. The reproducibility refers to variation between test conditions. This split between repeatability and
reproducibility can provide some vital hints to help diagnose possible causes.
From this table, it is known that the process capability is as follows:
Process average, X-bar = 0.812
Process standard deviation, S
p
= 0.179
The measurement precision is:
Measurement variability, S
R&r
= 0.043
Measurement Precision Study: Scorecard
Variability Summary
Remarks
0.03076
Standard deviation of the within condition variation
0.03038
Standard deviation of the between condition variation
0.04324
Standard deviation of the measurement process
0.17983
Standard deviation of the product variation
0.18495
Standard deviation of the total observed variation
0.81233
Average of all product measurements taken during study
Comparison to Specifications
(Only used when both specifications exist)
% Repeatability 39.6067 Percent of specification width used by repeatability error
39.1143 Percent of specification width used by reproducibility error
% Measurement R&r 55.6652
Percent of specification width used by measurement error
Compared to the specification limits, the precision of
this measurement:
Comparison to Total Variation
% Repeatability 2.76653 Percent of total variability used by repeatability error
% Reproducibility
2.69817
Percent of total variability used by reproducibility error
% Measurement R&r
5.46469
Percent of total variability used by measurement error
Compared to the total variability, the precision of
this measurement:
Measurement Tolerance
Measurement Tolerance
Units
mm
On the basis of this study, there is a 99% chance that
this interval around the measured product performance
will contain the actual product performance level.
Needs improvement
Is adequate
Product Average
+/- 0.111243938
% Reproducibility
Repeatability
Reproducibility
Measurement R&r
Process std dev
Total Variability
8
Users
Guide
January
2003
Scorecard