IPC-TM-650 EN 2022 试验方法--.pdf - 第44页
Below i s a view of the d ata entry panel from the s preadsheet. In this case there are t hree testers, making two readings on each of the dif ferent p arts. This pan el can be somewhat confusing at first, so a review of …
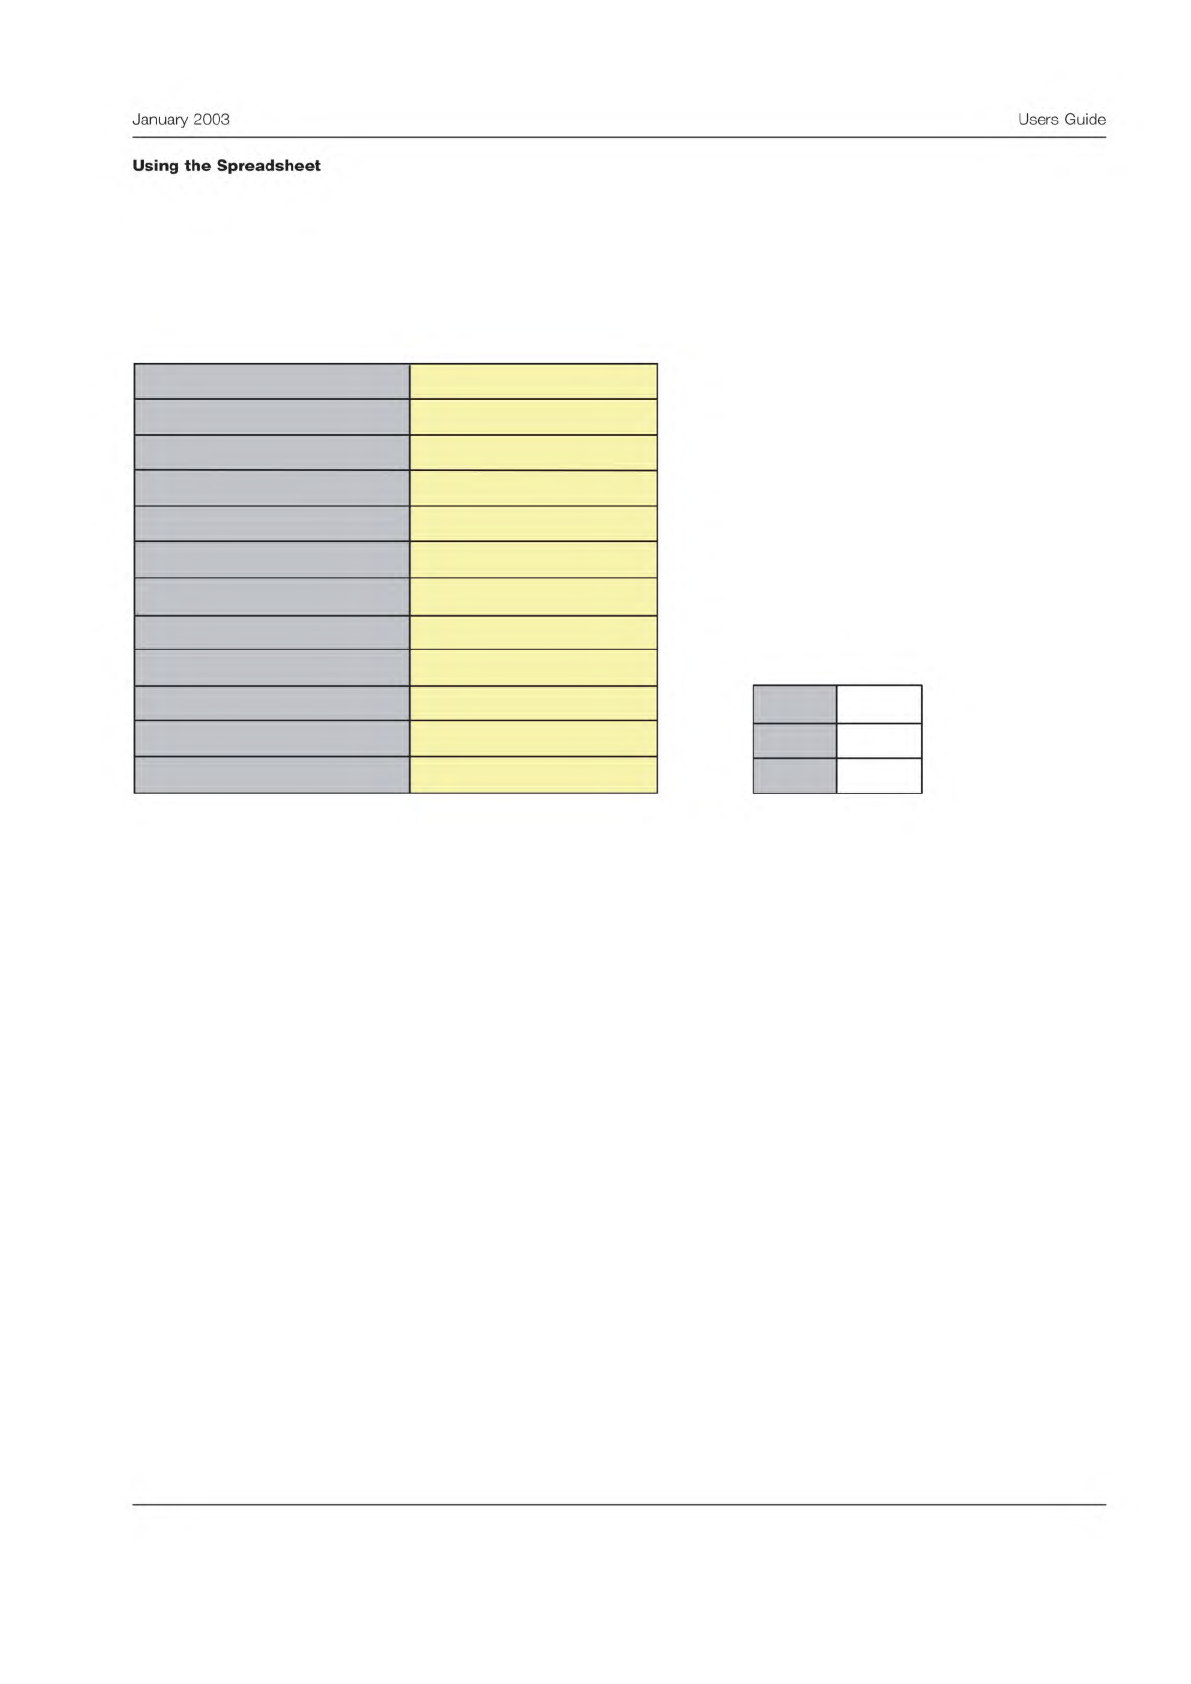
Header Section
Begin by completing the yellow area in the header. Fill in as completely as possible to prevent confusion later. The header
section is shown below.
The spreadsheet calculates the appropriate value of the K-factors, and displays them to the right of the section with the
header information. Here, the example involves measuring the thickness of gaskets. They chose to have two testers measure
the thickness of four samples once a day for four days.
The MSA data can be entered in the next section. Again fill in the yellow areas. Be sure and check that the data was recorded
correctly and verify it is transcribed into the spreadsheet accurately. The analysis will be of little worth if there are typos.
Measurement Precision Study: Information Sheet
Version 1.0, April 2002
Enter data into yellow areas.
K
2
2.7
K
3
1.62
K
1
4.57
10
2
Gasket Thickness
1
3
mm
0.6
Test Method
Parameter Measured
Company
Name of Study Organizer
Upper Specification Limit, USL
Number of Test Conditions, m
Number of Samples, n
Number of Repeat Readings, k
Study Completion Date
Instrument
Measurement Units
Lower Specification Limit, LSL
3
January
2003
Users
Guide
Using
the
Spreadsheet
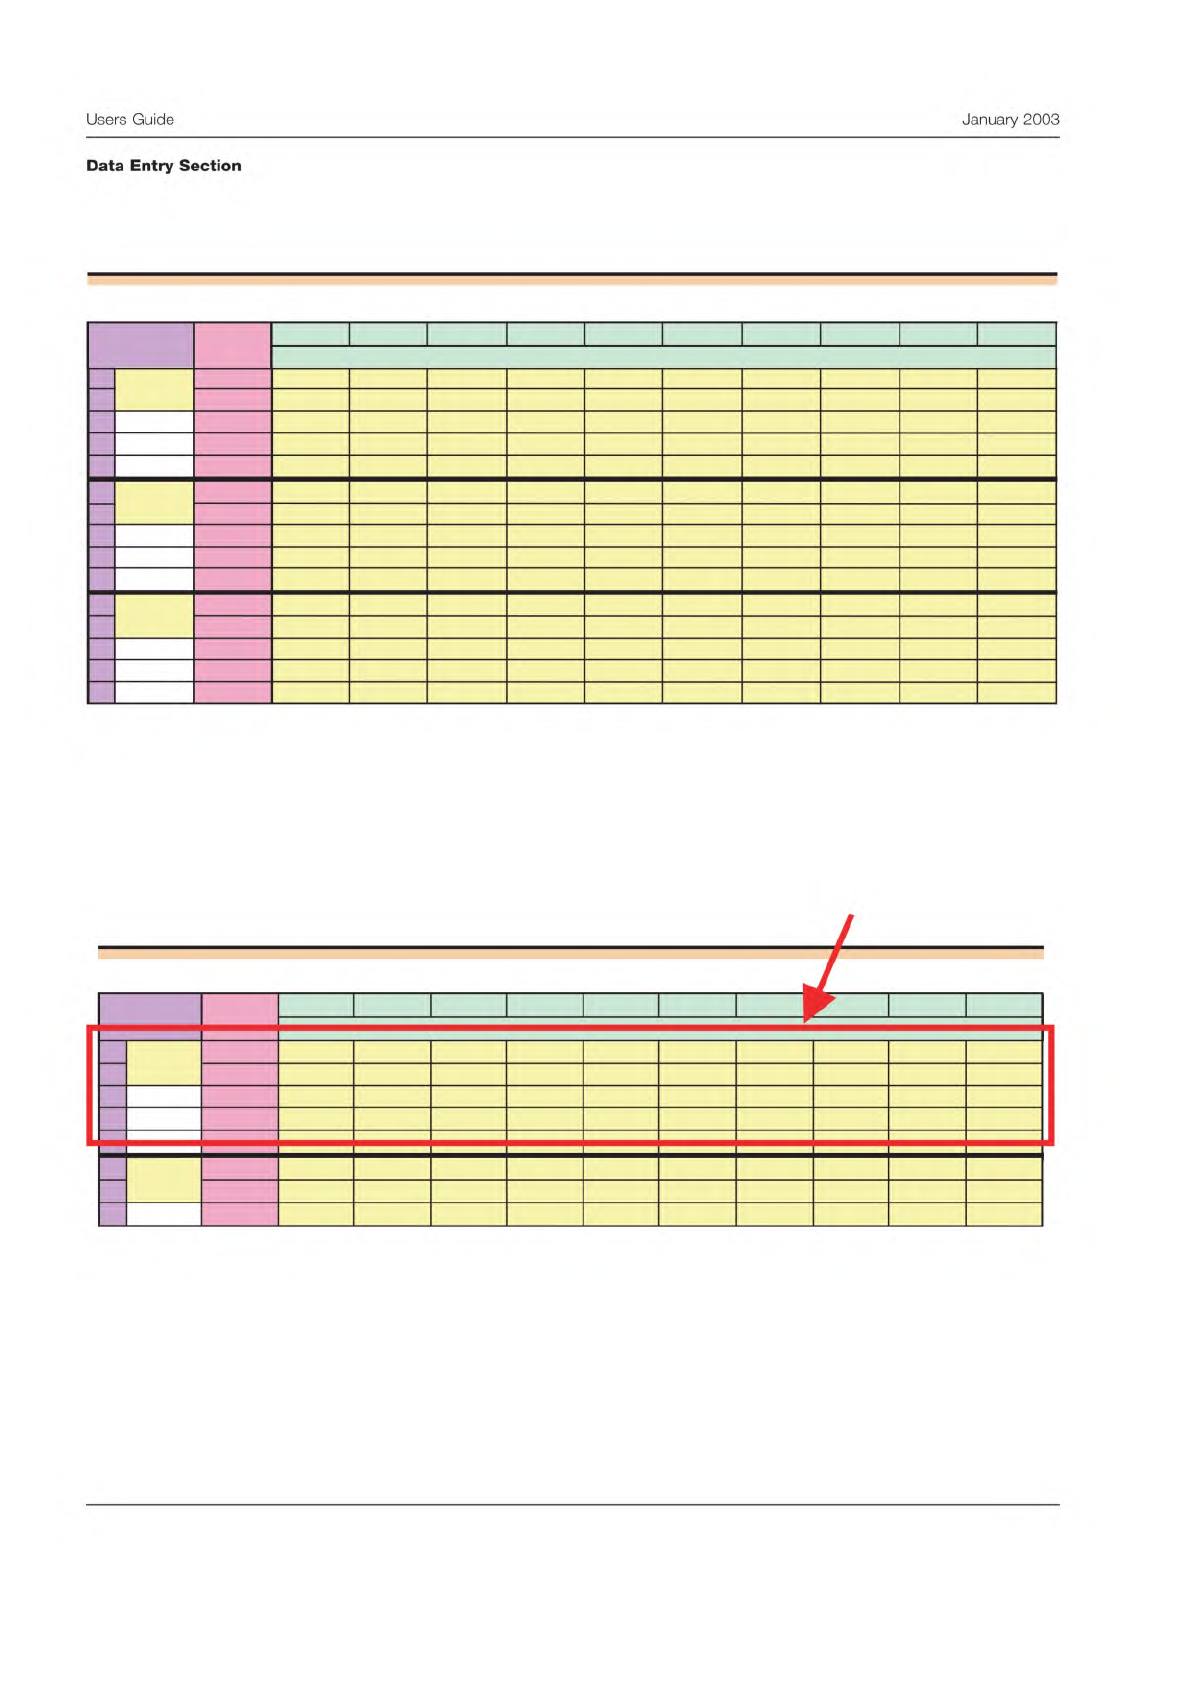
Below is a view of the data entry panel from the spreadsheet. In this case there are three testers, making two readings on
each of the different parts.
This panel can be somewhat confusing at first, so a review of how the sections are organized will be helpful.
The data for each tester is entered in horizontal sections.
Measurement Precision Study: Data Entry Sheet
Sample Sample Sample
Sample Sample Sample Sample Sample Sample Sample
1 2
3
4 5 6 7 8 9 10
1 1 0.62 0.99 0.82 0.85 0.59 1.02 0.97 0.85 1 0.61
2 0.66 1 0.81 0.89 0.48 1.03 0.97 0.82 1 0.7
3
4
5
2 1 0.53 1.05 0.8 0.83 0.39 1.04 0.97 0.73 0.98 0.54
2 0.53 0.93 0.77 0.76 0.4 1.08 0.91 0.7 0.95 0.6
3
4
5
3
1 0.51 1.05 0.8
0.79 0.45 1.01 0.96 0.8 1.04 0.84
2 0.55 1.02 0.77 0.81 0.49 1.05 0.96 0.81 1.05 0.81
3
4
5
Reading
Condition
Station 3
Station 1
Station 2
Measurement Precision Study: Data Entry Sheet
Sample Sample Sample Sample Sample Sample Sample Sample Sample Sample
1 2 3 4 5 6 7 8 9 10
1 1 0.62 0.99 0.82 0.85 0.59 1.02 0.97 0.85 1 0.61
2 0.66 1 0.81 0.89 0.48 1.03 0.97 0.82 1 0.7
3
4
5
2
1 0.53 1.05 0.8 0.83 0.39 1.04 0.97 0.73 0.98 0.54
2 0.53 0.93 0.77 0.76 0.4 1.08 0.91 0.7 0.95 0.6
3
Condition
Station 1
Station 2
Reading
Data for one
test condition
4
Users
Guide
January
2003
Data
Entry
Section
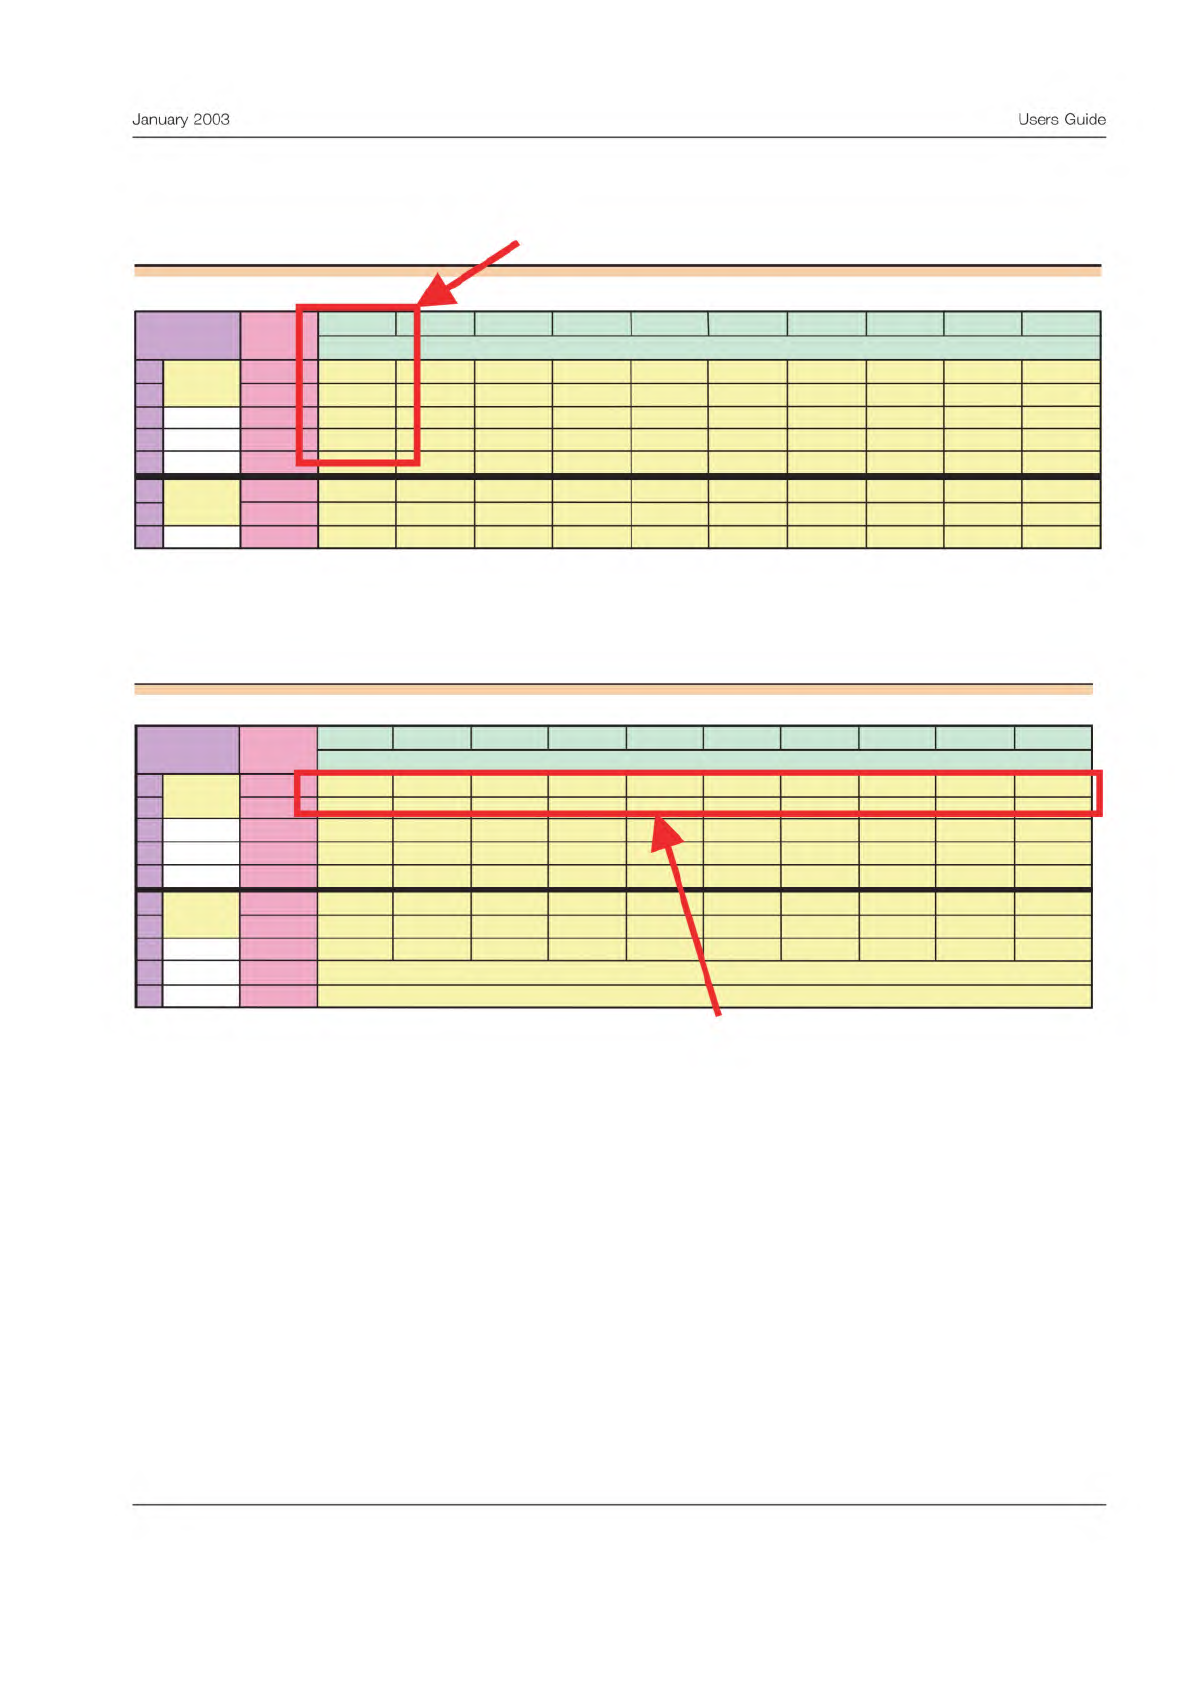
Within the section for a given test condition, the repeated readings for each part are entered in columns, as shown below.
Therefore each row within the test condition area represents one complete set of readings for one test round for that tester.
Measurement Precision Study: Data Entry Sheet
Sample
Sample
Sample Sample
Sample
Sample
Sample
Sample
Sample
Sample
1 2
3
4
5
6
7 8
9
10
1 1 0.62 0.99 0.82 0.85
0.59 1.02 0.97 0.85 1
0.61
2 0.66 1 0.81 0.89
0.48 1.03 0.97 0.82
1 0.7
3
4
5
2
1 0.53 1.05 0.8 0.83 0.39 1.04 0.97 0.73
0.98 0.54
2 0.53 0.93 0.77 0.76 0.4 1.08 0.91 0.7
0.95
0.6
3
Condition
Station 1
Station 2
Reading
Data for on
test sample
Measurement Precision Study: Data Entry Sheet
Sample
Sample
Sample
Sample
Sample
Sample
Sample Sample Sample Sample
1 2 3 4
5
6
7 8
9
10
1 1 0.62 0.99 0.82 0.85 0.59 1.02 0.97 0.85 1 0.61
2 0.66 1 0.81
0.89
0.48
1.03
0.97 0.82 1
0.7
3
4
5
2 1 0.53 1.05 0.8 0.83
0.39
1.04 0.97 0.73 0.98 0.54
2
0.53 0.93 0.77 0.76 0.4
1.08
0.91 0.7 0.95 0.6
3
4
5
Condition
Station 1
Station 2
Reading
First round of measurements on
all samples for one test condition
5
January
2003
Users
Guide