IPC-TM-650 EN 2022 试验方法--.pdf - 第48页
The sc orecard shows four dif ferent sets of ca lculations. This array of calculations reflects dif ferent approaches many find useful. The first section shows a summary of t he variability calculations. The t able shows ca…
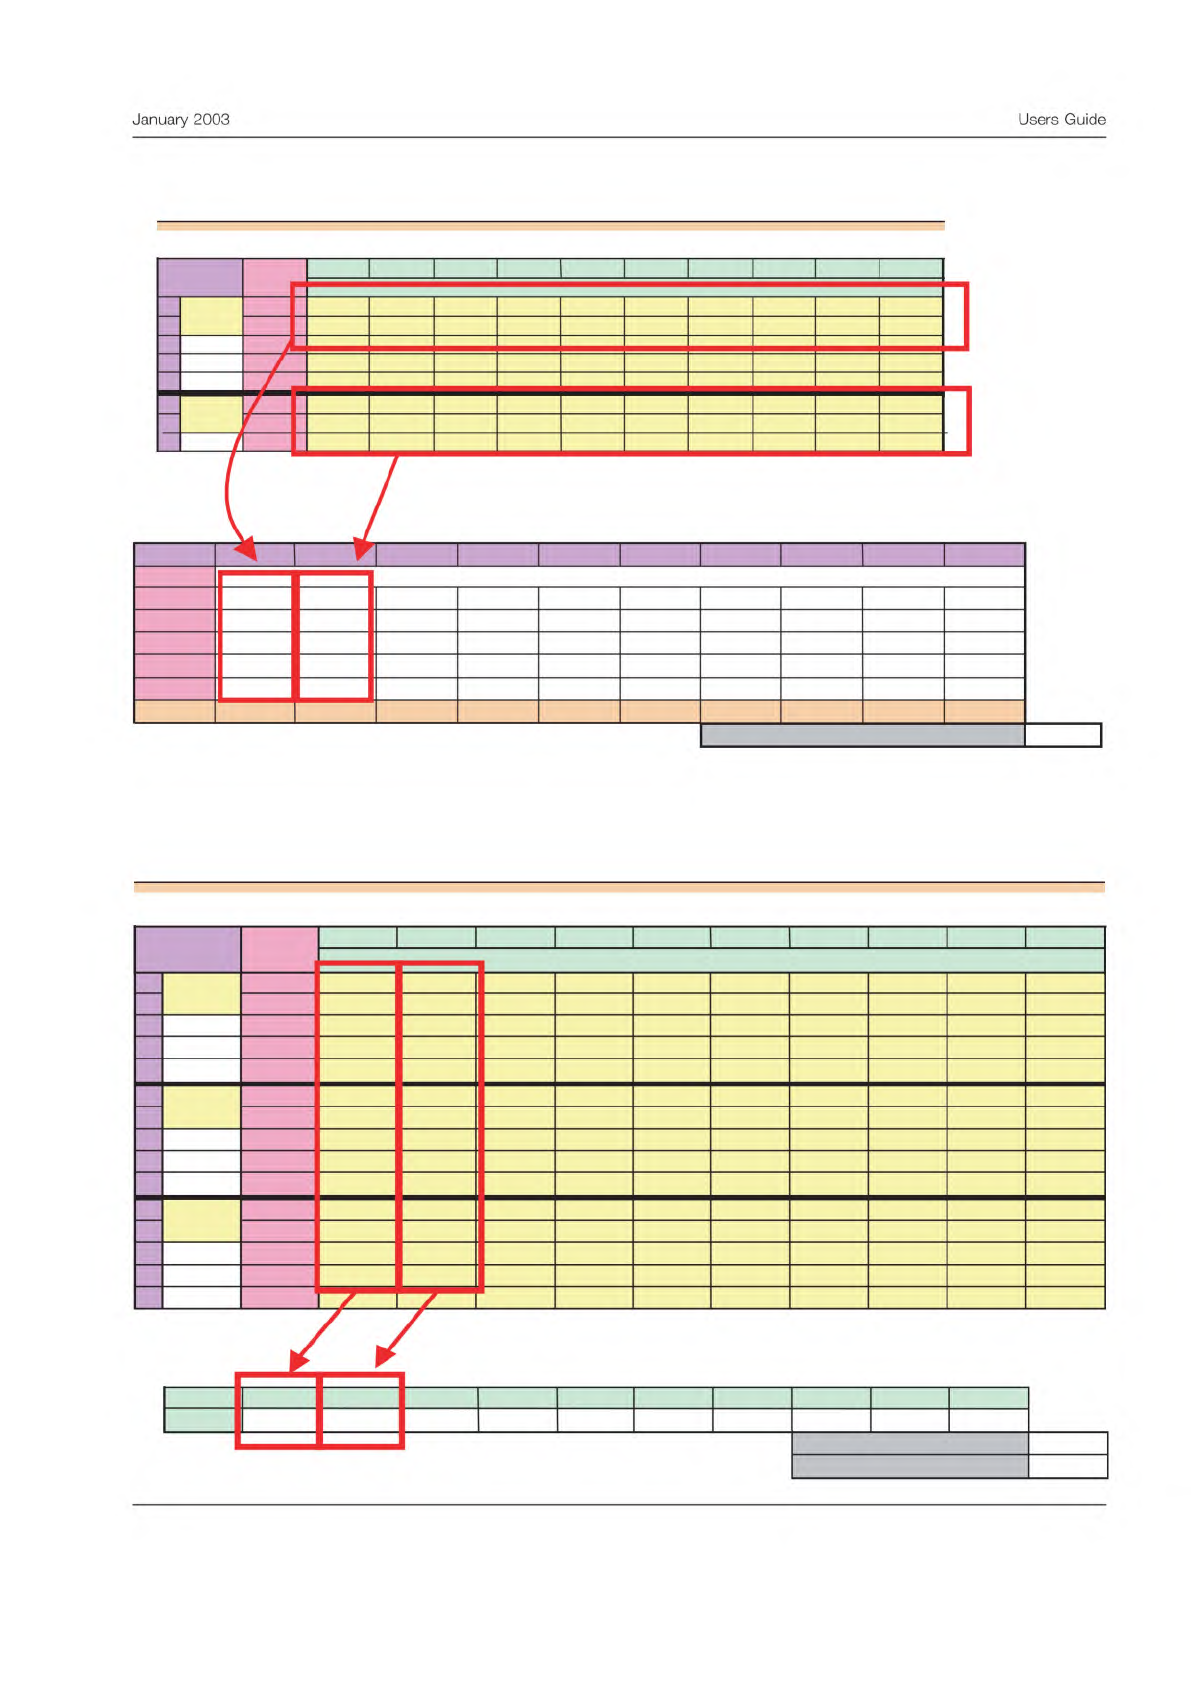
The next calculation table shows, for each test condition, the average of all sample measurements for each repetition.
The final table shows the overall average of all repetitions of all measurements across all test conditions.
Averages:
Condition
1 2 3 4 5 6 7 8 9 10
Readings
Set 1 0.83200 0.786 0.825
Set 2 0.836 0.763 0.832
Set 3
Set 4
Set 5
Op Avg 0.834 0.7745 0.8285
Absolute difference of condition averages
0.0595
Measurement Precision Study: Data Entry Sheet
Sample Sample Sample Sample Sample Sample Sample Sample Sample Sample
1 2 3 4 5 6 7 8 9 10
1 1 0.62 0.99 0.82 0.85 0.59 1.02 0.97 0.85 1 0.61
2 0.66 1 0.81 0.89 0.48
1.03 0.97 0.82 1 0.7
3
4
5
2 1 0.53 1.05 0.8 0.83 0.39 1.04 0.97
0.73
0.98 0.54
2 0.53 0.93 0.77 0.76 0.4 1.08 0.91
0.7 0.95 0.6
3
Condition
Station 1
Station 2
Reading
Average of each set of readings for each test condition
Sample 1 2 3 4 5 6
7
8 9
10
Avg 0.56667
1.00667 0.795
0.82167
0.46667
1.03833
0.95667 0.785
1.00333
0.68333
Average of sample averages
0.81233
Range of sample averages
0.57167
Measurement Precision Study: Data Entry Sheet
Sample Sample Sample Sample
Sample Sample Sample Sample Sample Sample
1 2 3 4 5 6 7 8 9 10
1 1 0.62 0.99 0.82 0.85 0.59 1.02
0.97 0.85
1 0.61
2
0.66 1 0.81 0.89 0.48 1.03 0.97 0.82 1 0.7
3
4
5
2
1 0.53 1.05 0.8 0.83 0.39 1.04
0.97 0.73
0.98
0.54
2 0.53 0.93 0.77 0.76 0.4 1.08
0.91 0.7 0.95
0.6
3
4
5
3 1 0.51 1.05 0.8 0.79
0.45 1.01 0.96 0.8 1.04
0.84
2 0.55 1.02 0.77
0.81
0.49 1.05 0.96 0.81 1.05
0.81
3
4
5
Condition
Station 3
Station 1
Station 2
Reading
Average of all readings
For each sample
7
January
2003
Users
Guide
—
/
—
%
/
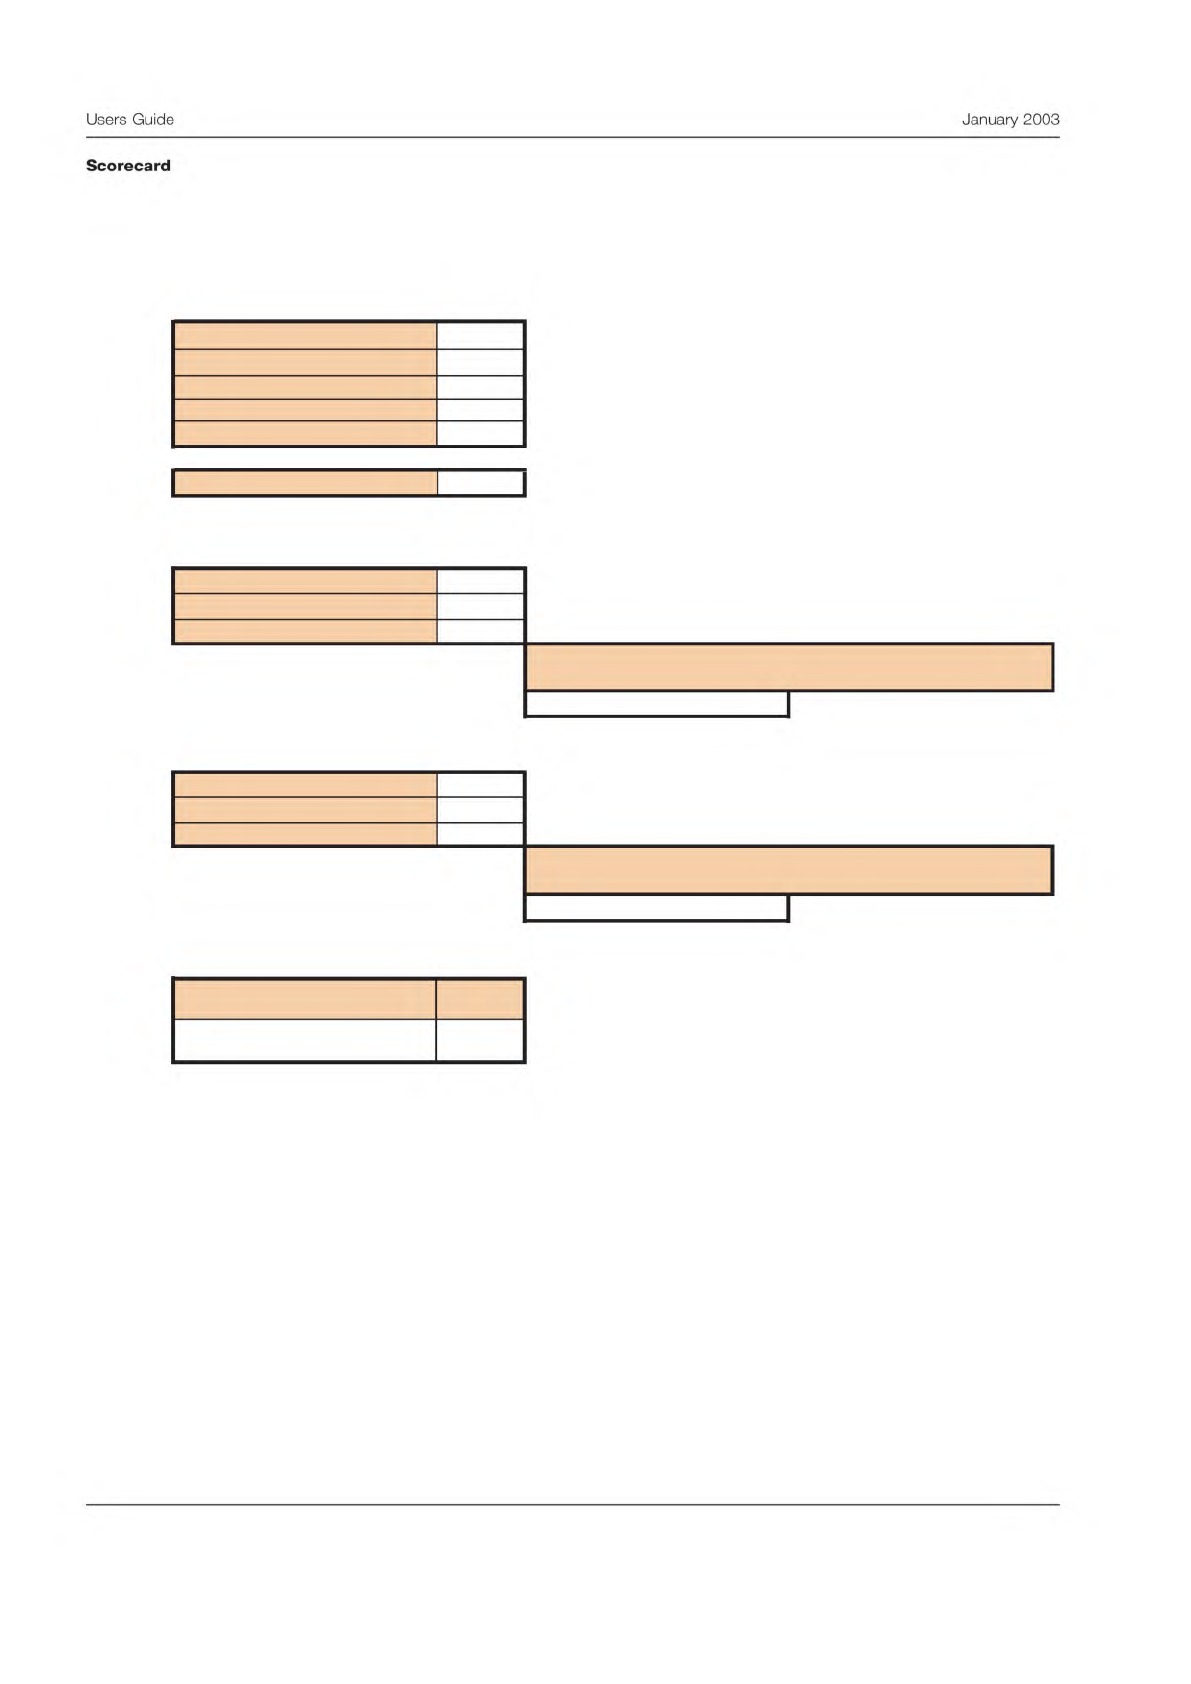
The scorecard shows four different sets of calculations. This array of calculations reflects different approaches many find
useful.
The first section shows a summary of the variability calculations. The table shows calculated standard deviations. Starting
at the bottom, the table shows the total observed variation. Next the total variation is split into two portions, the process
variation and the total measurement variation, called measurement R&r. Process variation reflects differences in product per-
formance. The measurement variation reflects just differences in the measurement of this performance. The top two numbers
split the measurement variation into two portions, repeatability and reproducibility. The repeatability refers to variation
within a test condition. The reproducibility refers to variation between test conditions. This split between repeatability and
reproducibility can provide some vital hints to help diagnose possible causes.
From this table, it is known that the process capability is as follows:
Process average, X-bar = 0.812
Process standard deviation, S
p
= 0.179
The measurement precision is:
Measurement variability, S
R&r
= 0.043
Measurement Precision Study: Scorecard
Variability Summary
Remarks
0.03076
Standard deviation of the within condition variation
0.03038
Standard deviation of the between condition variation
0.04324
Standard deviation of the measurement process
0.17983
Standard deviation of the product variation
0.18495
Standard deviation of the total observed variation
0.81233
Average of all product measurements taken during study
Comparison to Specifications
(Only used when both specifications exist)
% Repeatability 39.6067 Percent of specification width used by repeatability error
39.1143 Percent of specification width used by reproducibility error
% Measurement R&r 55.6652
Percent of specification width used by measurement error
Compared to the specification limits, the precision of
this measurement:
Comparison to Total Variation
% Repeatability 2.76653 Percent of total variability used by repeatability error
% Reproducibility
2.69817
Percent of total variability used by reproducibility error
% Measurement R&r
5.46469
Percent of total variability used by measurement error
Compared to the total variability, the precision of
this measurement:
Measurement Tolerance
Measurement Tolerance
Units
mm
On the basis of this study, there is a 99% chance that
this interval around the measured product performance
will contain the actual product performance level.
Needs improvement
Is adequate
Product Average
+/- 0.111243938
% Reproducibility
Repeatability
Reproducibility
Measurement R&r
Process std dev
Total Variability
8
Users
Guide
January
2003
Scorecard
The next table in the scorecard is shown below. It compares the measurement variation to the specifications for this prod-
uct. This table will only have numbers in it if there are two specifications. In this example, there are two specs, so the table
is complete.
The numbers in the table are percentages. The calculations show what portion of the specification width is used up by mea-
surement error. The total measurement variability, called S
R&r
, consumes 55% of the specification width. This is higher than
is considered acceptable. A good measurement would consume less than 10% of the spec width. An unacceptable measure-
ment would consume more than 33% of the spec width. Note that this conclusion is confirmed by the dialog box at the bot-
tom of the table.
The graph plainly shows that an unacceptable number of the gaskets measured will fail, and that this failure rate is driven
by the measurement error. The process capability must also be improved, but the measurement must be improved before one
can be sure that measurements will be precise enough to reflect true product performance. To help diagnose the cause of the
measurement variation, the repeatability and reproducibility estimates are included. In this example the measurement varia-
tion is roughly equally split between within and between test condition sources. Therefore there may be several sources of
variation, with no one dominant cause.
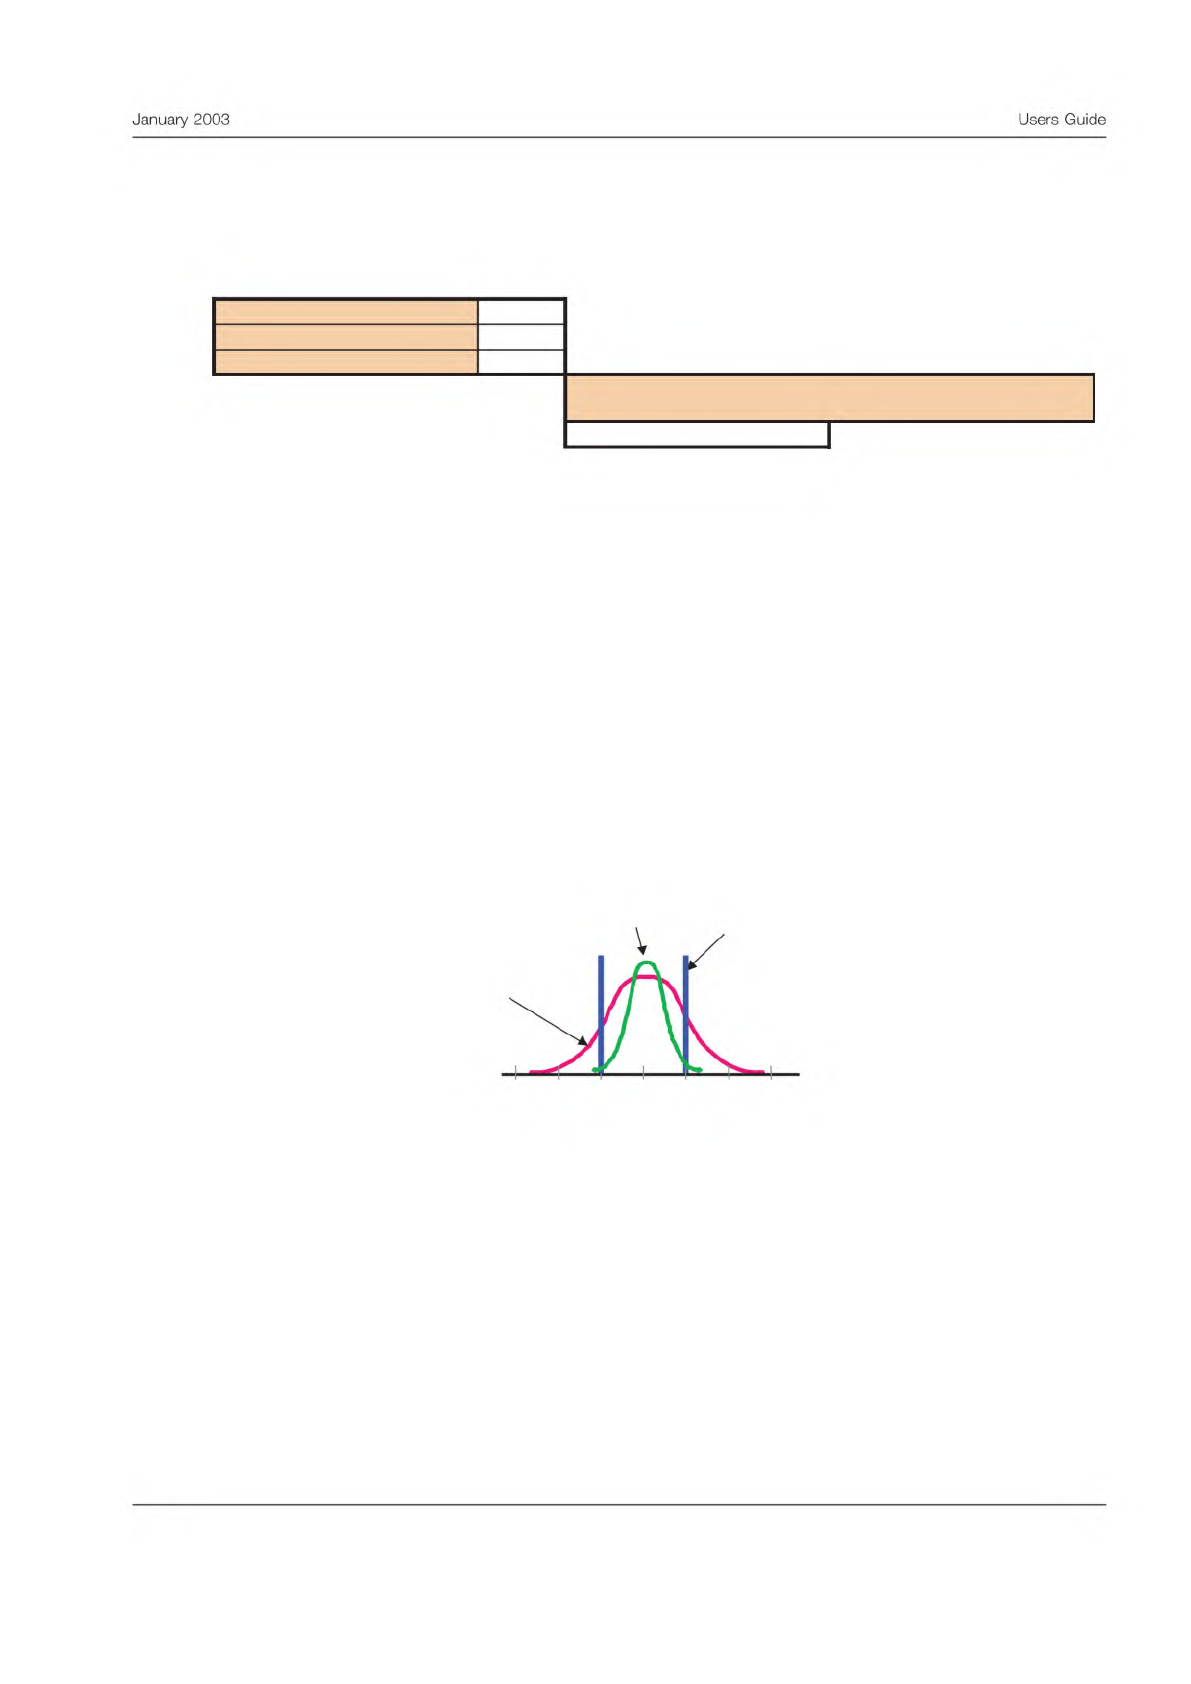
A graph is often more compelling than the numbers. If one graphs the total observed variation and process variation as nor-
mal curves and superimpose the spec limits, the following graph would emerge:
This graph is prepared by creating normal curves which center on the overall product average, and extend out three times
the applicable standard deviation in each direction. For the total observed variation, the total variation was used. For the
process capability curve the product variability was used.
Comparison to Specifications
(Only used when both specifications exist)
% Repeatability
39.6067 Percent of specification width used by repeatability error
39.1143
Percent of specification width used by reproducibility error
% Measurement R&r 55.6652
Percent of specification width used by measurement error
Compared to the specification limits, the precision of
this measurement:
Needs improvement
% Reproducibility
0.2 0.4 0.6 0.8 1.0 1.2 1.4
Spec
limits
Total
observed
variation
Process
capability
9
January
2003
Users
Guide