IPC-TM-650 EN 2022 试验方法--.pdf - 第79页
T a ble 1 T ype 1 +150µm +75 µm +20 µm –20 µm T ype 2 + 7 5 µm +45 µm +20 µm –20 µm T ype 3 + 4 5 µm +25 µm +20 µm –20 µm T ype 4 + 3 8 µm +20 µm –20 µm T ype 5 + 3 0 µm +15 µm –15 µm T ype 6 + 1 5 µm + 5 µm – 5 µm The I…
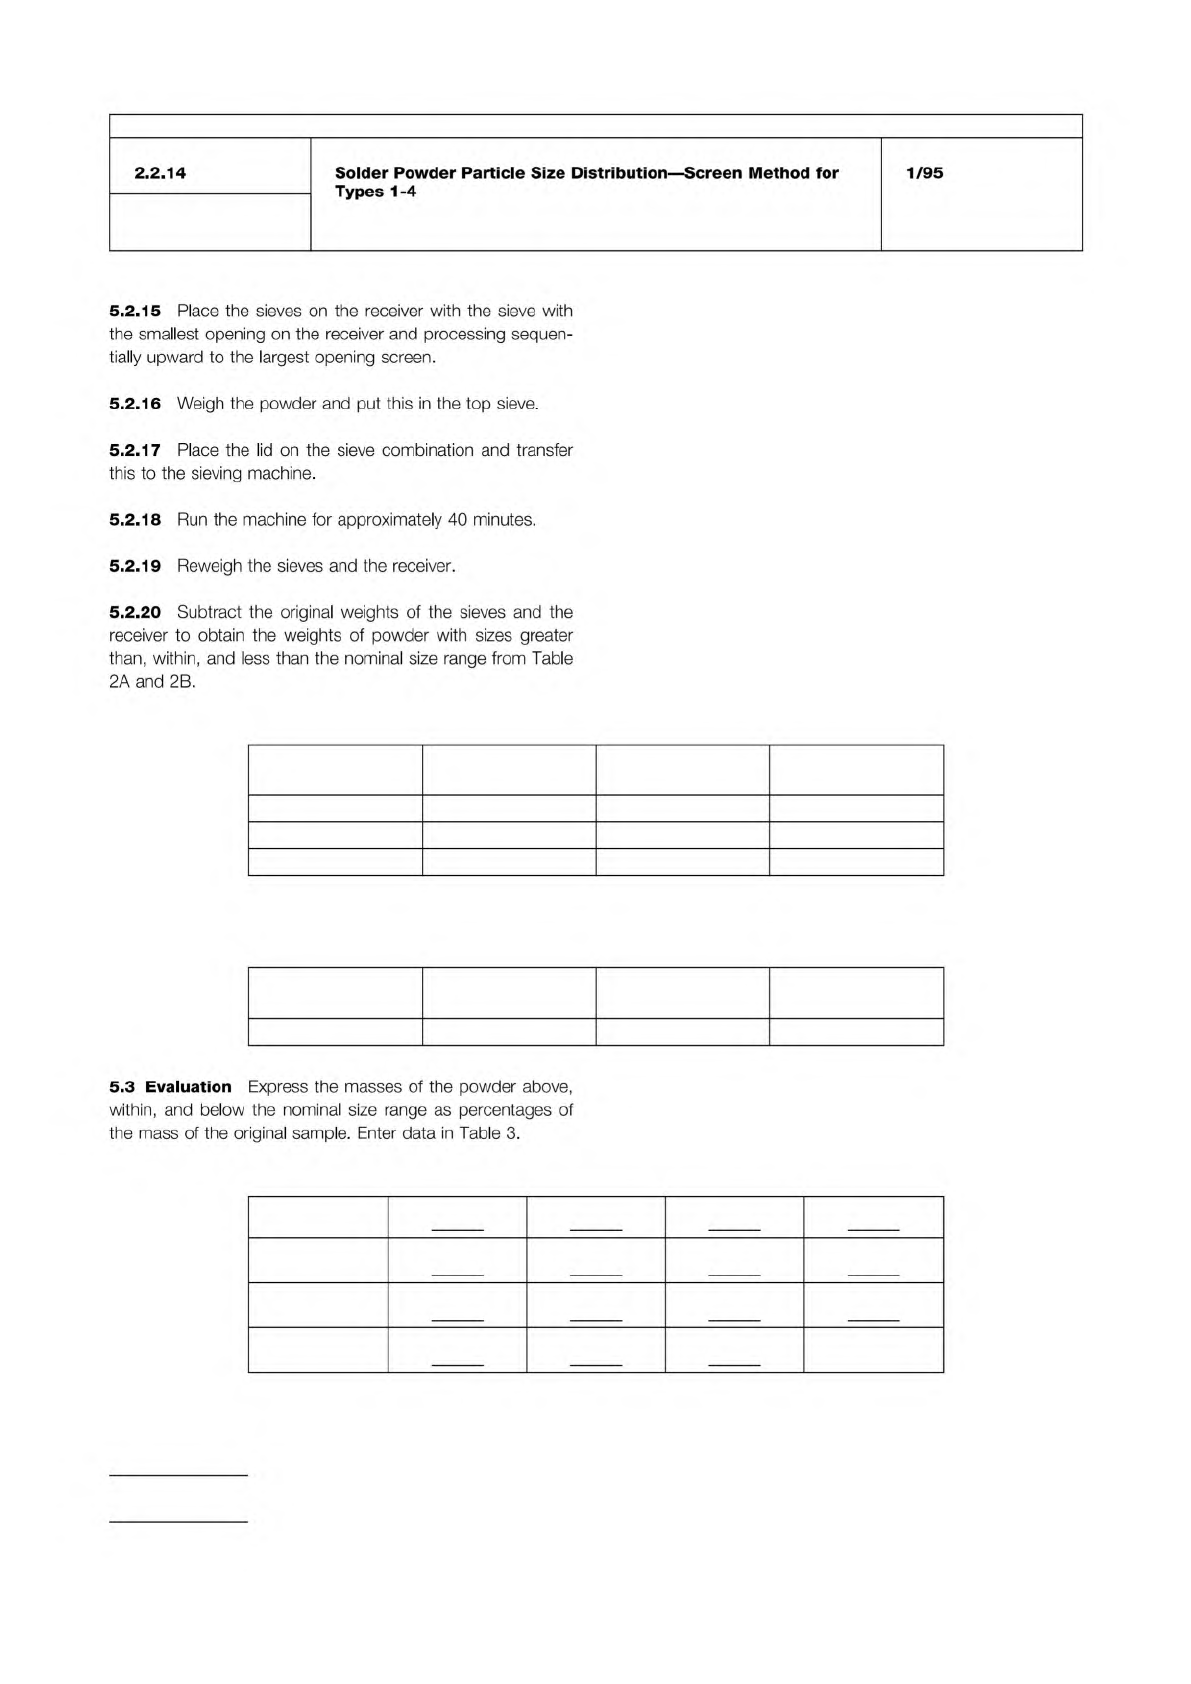
Table 2A % of Sample by Weight—Nominal Sizes
Less Than 1%
Larger Than
80% Minimum
Between
10% Maximum
Less Than
Type 1 150 Microns 150–75 Microns 20 Microns
Type 2 75 Microns 75–45 Microns 20 Microns
Type 3 45 Microns 45–25 Microns 20 Microns
Table 2B % of Sample by Weight—Nominal Sizes
Less Than 1%
Larger Than
90% Minimum
Between
10% Maximum
Less Than
Type 4 38 Microns 38−20 Microns 20 Microns
Table 3
Type 1 +150µm +75 µm +20 µm –20 µm
Type 2 + 75 µm +45 µm +20 µm –20 µm
Type 3 + 45 µm +25 µm +20 µm –20 µm
Type 4 + 38 µm +20 µm –20 µm
IPC-TM-650
Number
Subject Date
Revision
Page 2 of 2
2.2.14
Solder
Powder
Particle
Size
Distribution
—
Screen
Method
for
Types
1-4
1/95
5.2.15
Place
the
sieves
on
the
receiver
with
the
sieve
with
the
smallest
opening
on
the
receiver
and
processing
sequen¬
tially
upward
to
the
largest
opening
screen.
5.2.16
Weigh
the
powder
and
put
this
in
the
top
sieve.
5.2.17
Place
the
lid
on
the
sieve
combination
and
transfer
this
to
the
sieving
machine.
5.2.18
Run
the
machine
for
approximately
40
minutes.
5.2.19
Reweigh
the
sieves
and
the
receiver.
5.2.20
Subtract
the
original
weights
of
the
sieves
and
the
receiver
to
obtain
the
weights
of
powder
with
sizes
greater
than,
within,
and
less
than
the
nominal
size
range
from
Table
2A
and
2B.
5.3
Evaluation
Express
the
masses
of
the
powder
above,
within,
and
below
the
nominal
size
range
as
percentages
of
the
mass
of
the
original
sample.
Enter
data
in
Table
3.
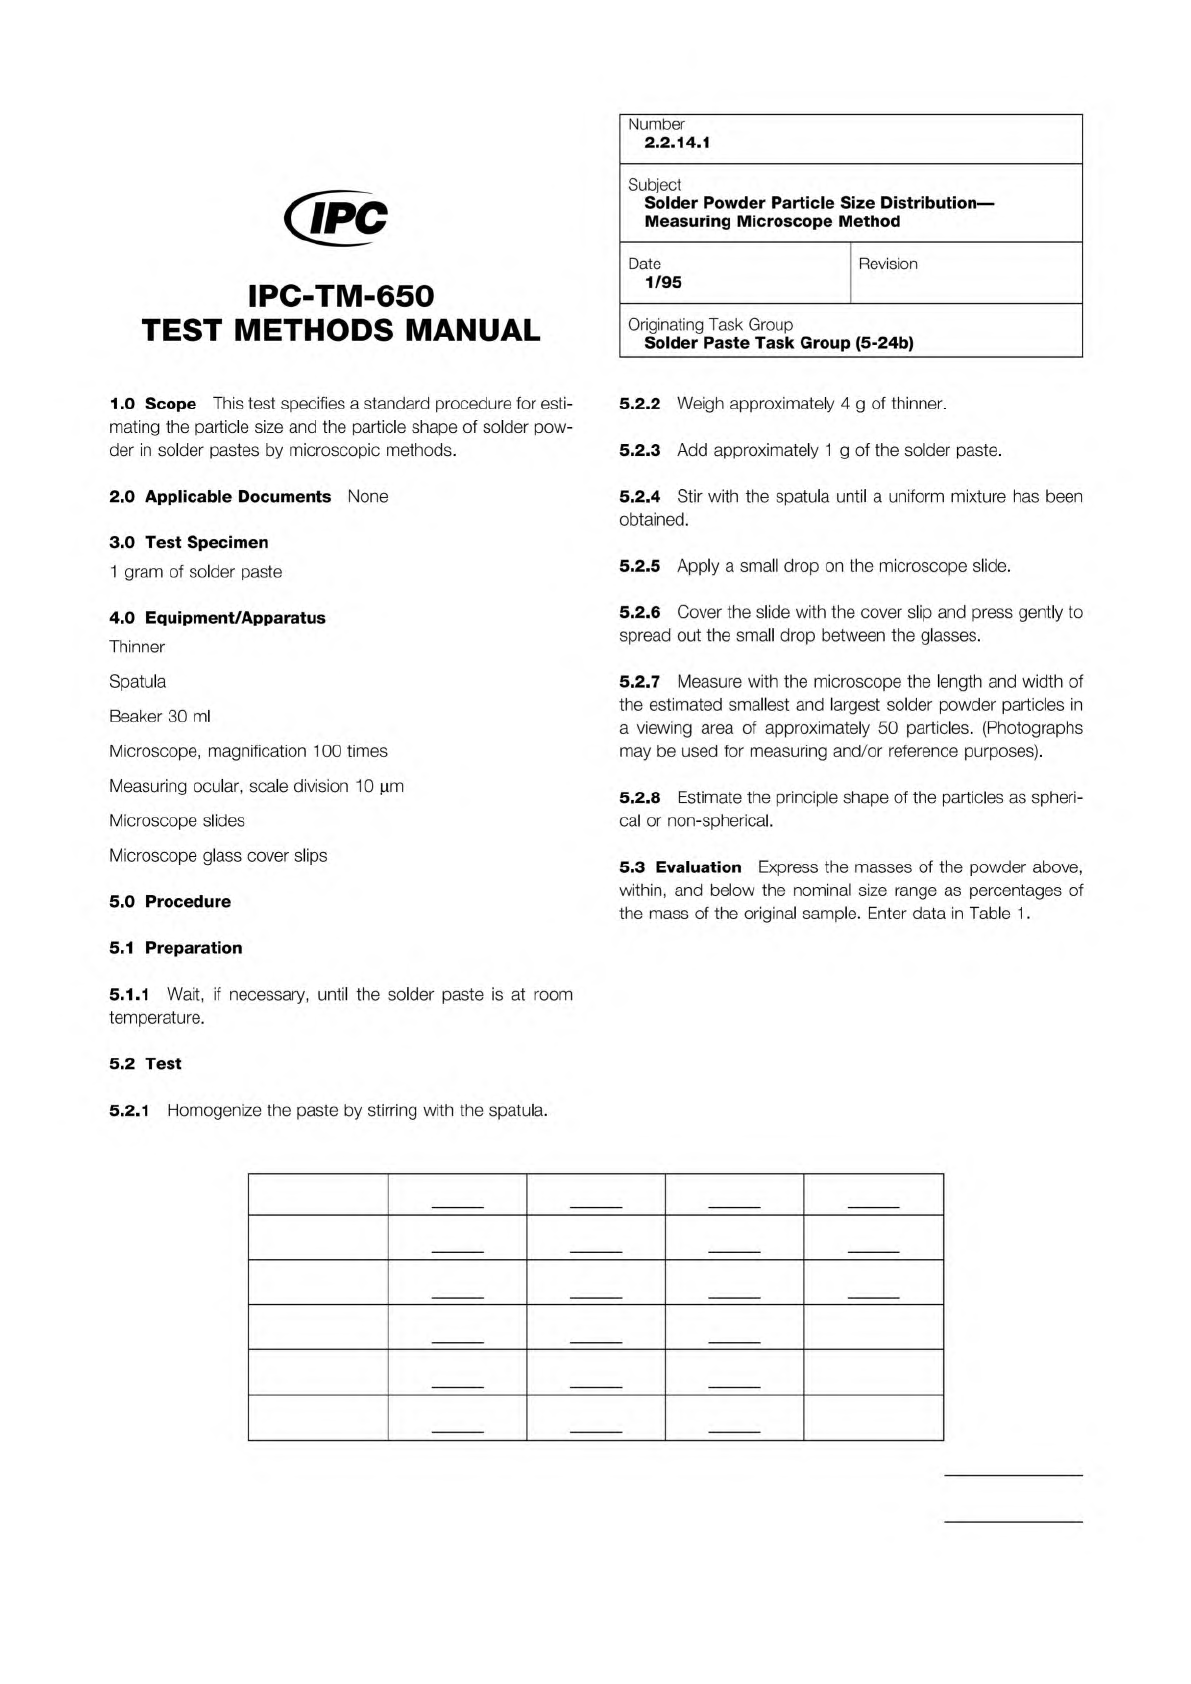
Table 1
Type 1 +150µm +75 µm +20 µm –20 µm
Type 2 + 75 µm +45 µm +20 µm –20 µm
Type 3 + 45 µm +25 µm +20 µm –20 µm
Type 4 + 38 µm +20 µm –20 µm
Type 5 + 30 µm +15 µm –15 µm
Type 6 + 15 µm + 5 µm – 5 µm
The Institute for Interconnecting and Packaging Electronic Circuits
2215 Sanders Road • Northbrook, IL 60062
Material in this Test Methods Manual was voluntarily established by Technical Committees of the IPC. This material is advisory only
and its use or adaptation is entirely voluntary. IPC disclaims all liability of any kind as to the use, application, or adaptation of this
material. Users are also wholly responsible for protecting themselves against all claims or liabilities for patent infringement.
Equipment referenced is for the convenience of the user and does not imply endorsement by the IPC.
Page 1 of 1
IPC-TM-650
TEST
METHODS
MANUAL
1
.0
Scope
This
test
specifies
a
standard
procedure
for
esti¬
mating
the
particle
size
and
the
particle
shape
of
solder
pow¬
der
in
solder
pastes
by
microscopic
methods.
2
.0
Applicable
Documents
None
3
.0
Test
Specimen
1
gram
of
solder
paste
4
.0
Equipment/Apparatus
Thinner
Spatula
Beaker
30
ml
Microscope,
magnification
1
00
times
Measuring
ocular,
scale
division
1
0
|im
Microscope
slides
Microscope
glass
cover
slips
5
.0
Procedure
5.1
Preparation
5.1.1
Wait,
if
necessaiy,
until
the
solder
paste
is
at
room
temperature.
5.2
Test
Number
2.2.14.1
Subject
Solder
Powder
Particle
Size
Distribution
—
Measuring
Microscope
Method
Date
Revision
1/95
Originating
Task
Group
Solder
Paste
Task
Group
(5-24b)
5.2.2
Weigh
approximately
4
g
of
thinner.
5.2.3
Add
approximately
1
g
of
the
solder
paste.
5.2.4
Stir
with
the
spatula
until
a
uniform
mixture
has
been
obtained.
5.2.5
Apply
a
small
drop
on
the
microscope
slide.
5.2.6
Cover
the
slide
with
the
cover
slip
and
press
gently
to
spread
out
the
small
drop
between
the
glasses.
5.2.7
Measure
with
the
microscope
the
length
and
width
of
the
estimated
smallest
and
largest
solder
powder
particles
in
a
viewing
area
of
approximately
50
particles.
(Photographs
may
be
used
for
measuring
and/or
reference
purposes).
5.2.8
Estimate
the
principle
shape
of
the
particles
as
spheri¬
cal
or
non-spherical.
5.3
Evaluation
Express
the
masses
of
the
powder
above,
within,
and
below
the
nominal
size
range
as
percentages
of
the
mass
of
the
original
sample.
Enter
data
in
Table
1
.
5.2.1
Homogenize
the
paste
by
stirring
with
the
spatula.
The Institute for Interconnecting and Packaging Electronic Circuits
2215 Sanders Road • Northbrook, IL 60062
Material in this Test Methods Manual was voluntarily established by Technical Committees of the IPC. This material is advisory only
and its use or adaptation is entirely voluntary. IPC disclaims all liability of any kind as to the use, application, or adaptation of this
material. Users are also wholly responsible for protecting themselves against all claims or liabilities for patent infringement.
Equipment referenced is for the convenience of the user and does not imply endorsement by the IPC.
Page 1 of 2
IPC-TM-650
TEST
METHODS
MANUAL
Number
2.2.14.2
Subject
Solder
Powder
Particle
Size
Distribution
—
Optical
Image
Analyzer
Method
Date
1/95
Revision
Originating
Task
Group
Solder
Paste
Task
Group
(5-24b)
1
.0
Scope
This
test
method
is
designed
to
determine
pow¬
der
particle
size
distribution
in
creams
by
image
analysis.
2
.0
Applicable
Documents
None
3
.0
Test
Specimen
1
0
grams
of
solder
paste
4
.0
Equipment/Apparatus
Thinner
5
.0
Procedure
5.1
Preparation
5.1.1
Stencil
some
solder
cream
onto
a
glass
slide
using
a
5
or
6
mm
diameter,
0.1
mm
thick
stencil.
5.1.2
Apply
a
little
thinner
to
the
solder
paste
and
gently
disperse
the
paste
over
an
area
about
20
mm
diameter,
using
a
glass
rod.
Cover
with
a
22
mm
diameter
cover
glass
and
gently
press
to
give
a
monolayer
dispersion
of
powder
par¬
ticles
under
the
cover
glass.
It
is
important
to
get
a
good
dispersion
without
a
lot
of
bubbles
or
particle
agglomerates.
If
the
paste
you
are
exam¬
ining
has
a
high
metal
content,
remove
some
of
the
stencilled
paste
before
dispersing
it.
The
standard
stencils
are
suitable
for
85-86%
metal
paste.
5.1.3
Label
the
glass
slide
with
the
powder
batch
number.
5.2
Images
for
Analysis
The
next
step
is
to
put
1
0
or
1
5
images
from
each
sample
into
an
image
directory.
5.2.1
Start
up
the
image
analyzer.
5.2.2
Set
up
the
microscope
illumination
for
X10
and
select
the
X1
0
objective.
5.2.3
Put
the
slide
on
the
microscope,
focus,
swing
the
bin¬
ocular
eyepiece
to
the
left
sending
the
light
to
the
TV
camera,
and
refocus
on
the
screen.
5.2.4
Ensure
that
there
are
no
agglomerations
or
badly
out-
of-focus
particles
and
then
capture
the
image.
5.2.5
Capture
1
0
images
covering
the
slide
in
a
systematic
way
without
consciously
selecting
areas
(other
than
avoiding
agglomerations
and
areas
of
very
low
particle
density).
5.2.6
Record
the
number
of
the
slide
and
remove
from
the
microscope.
5.2.7
Put
the
next
slide
on
the
microscope
and
repeat
the
process.
5.2.8
When
all
the
samples
have
been
recovered,
swing
the
eyepiece
back
and
switch
off
the
microscope.
5.2.9
Comments
-
Do
not
change
the
illumination
between
samples.
-
Record
a
series
of
samples
at
the
same
magnification.
5.3
Image
Analysis
5.3.1
When
images
from
the
required
number
of
samples
have
been
entered,
select
'Multi
Sample
Size'
on
the
menu
(or
'One
Sample
Size'
for
a
single
sample).
An
image
in
red
and
blue
will
then
come
up
on
the
screen.
5.3.2
Using
the
left
and
center
buttons
on
the
mouse,
adjust
the
thresholds
until
the
red
areas
correspond
to
the
particles
to
be
measured.
Selecting
the
right
hand
button
allows
you
to
vary
the
line
on
the
screen
where
the
intensity
plot
is
mea¬
sured.
Adjust
the
top
threshold
so
that
it
is
about
halfway
down
the
intensity
minima.
Press
center
and
right
buttons
on
the
mouse
simultaneously.
5.3.3
You
should
now
see
a
green
rectangle
on
a
grey
image.
If
there
is
no
rectangle,
press
the
left
hand
button
until
one
appears.
5.3.4
A
particle
is
measured
if
the
top
of
the
particle
lies
within
the
rectangle,
so
the
size
and
position
of
the
rectangle
must
be
adjusted
so
that
the
sides
are
half
a
particle
diameter
from
the
sides
of
the
screen,
and
the
base
of
the
rectangle
a
whole
particle
diameter
from
the
bottom
of
the
screen.
The
top
of
the
rectangle
should
lie
along
the
top
of
the
screen.
The