IPC-TM-650 EN 2022 试验方法--.pdf - 第418页
IPC-TM-650 Number S ubject Date Revision Page 6 of 7 2.4.54 TestMethodforThermalTransmissionPropertiesof 09/2022 MetalBasedPrintedBoards(MBPB) N/A Equation 14). With the thickness from the m icrosect…
IPC-TM-650
Number Subject Date
Revision
Page 5 of 7
2.4.54
TestMethodforThermalTransmissionPropertiesof
09/2022
MetalBasedPrintedBoards(MBPB)
N/A
4.13
Use an element that maintains plane parallelism of the specimen and/or
the meter bars themselves (see Figure 3).
4.14
An appropriate device is required to produce the micro section. In order
to generate clean and reproducible results in the form of micro section, the
device must be able to grind and polish the sample (see IPC-TM-650 Test
Methods 2.1.1 or 2.1.1.2).
5 Procedure
5.1
First of all the heating and cooling source should be tempered. Tempering
of the apparatus / the system could have an influence of the measured force
and gap.
5.2
After the apparatus is tempered, tare the force measuring device, when
the heat flow meter bars do not touch.
5.3
After the force is tared, the thickness measuring device needs to be set
to zero as well, if it is implemented in the machine. Otherwise, it has to be
measured before and after measurement. Therefore, the specified surface
pressure should be applied without any specimen between the meter bars.
When the temperature field inside the meter bars is in steady state condition
(∆T/t≤0.2K/300s)thethicknessmeasurementcanbetared.
5.4
Use a liquid like oil or water-glycol to reduce the contact resistance
between the meter bars or the meter bars and the specimen.
5.5
Use asurface pressure of≥ 2.0 N/mm² to reduce the influence ofthe
contact resistances and improve the repeatability of the measurements.
5.6
Measure first the pure liquid (which reduces the contact resistances
between the sample to the meter bars) between the meter bars at the same
surface pressure as the sample (Table 1 Equation 7). From the measured
thermal resistance of the metal based substrate with the used liquid on the
upper and lower side, subtract the measured thermal resistance two times
from this value. See Equations 10 and 11 in Table 1.
5.7
Werecommendhavingatemperaturedifference∆Tacrossthesample≥
1.5 K to reduce the uncertainty. Measure below the glass transition point (TG)
toavoidnonlinearbehavior.Showthemiddletemperature,the∆Tacrossthe
sample and the uncertainty in the results file.
5.8
The measured values are the apparent thermal resistance of the stack
(e.g., Al-die-Cu) (Table 1 Equation 11). Show the results of the thermal
resistance in the dimension (mm²K)/W (Table 1 Equation 8) and the total
apparent thermal conductivity in W/(mK) (Table 1 Equation 9).
5.9
In order to get the apparent thermal conductivity and the thermal resistance
of the dielectric layer between top and base plate of the sample, it is necessary
to know the layer thicknesses of every sample layer. To measure these
thicknesses a microsection of the sample must be made (see IPC-TM-650
Test Methods 2.1.1 or 2.1.1.2 and Table 1 Equation 14). With
known thermal conductivities of the base and top plate of the sample (show in the results the assumed thermal
conductivity of the metals), the thermal resistances of these layers can be determined (Table 1 Equations 12
and 13). With a subtraction of the determined resistances from the apparent thermal resistance of the specimen,
the thermal resistance of the dielectric layer (incl. thermal contact resistances) can be determined (Table 1
1
2
3
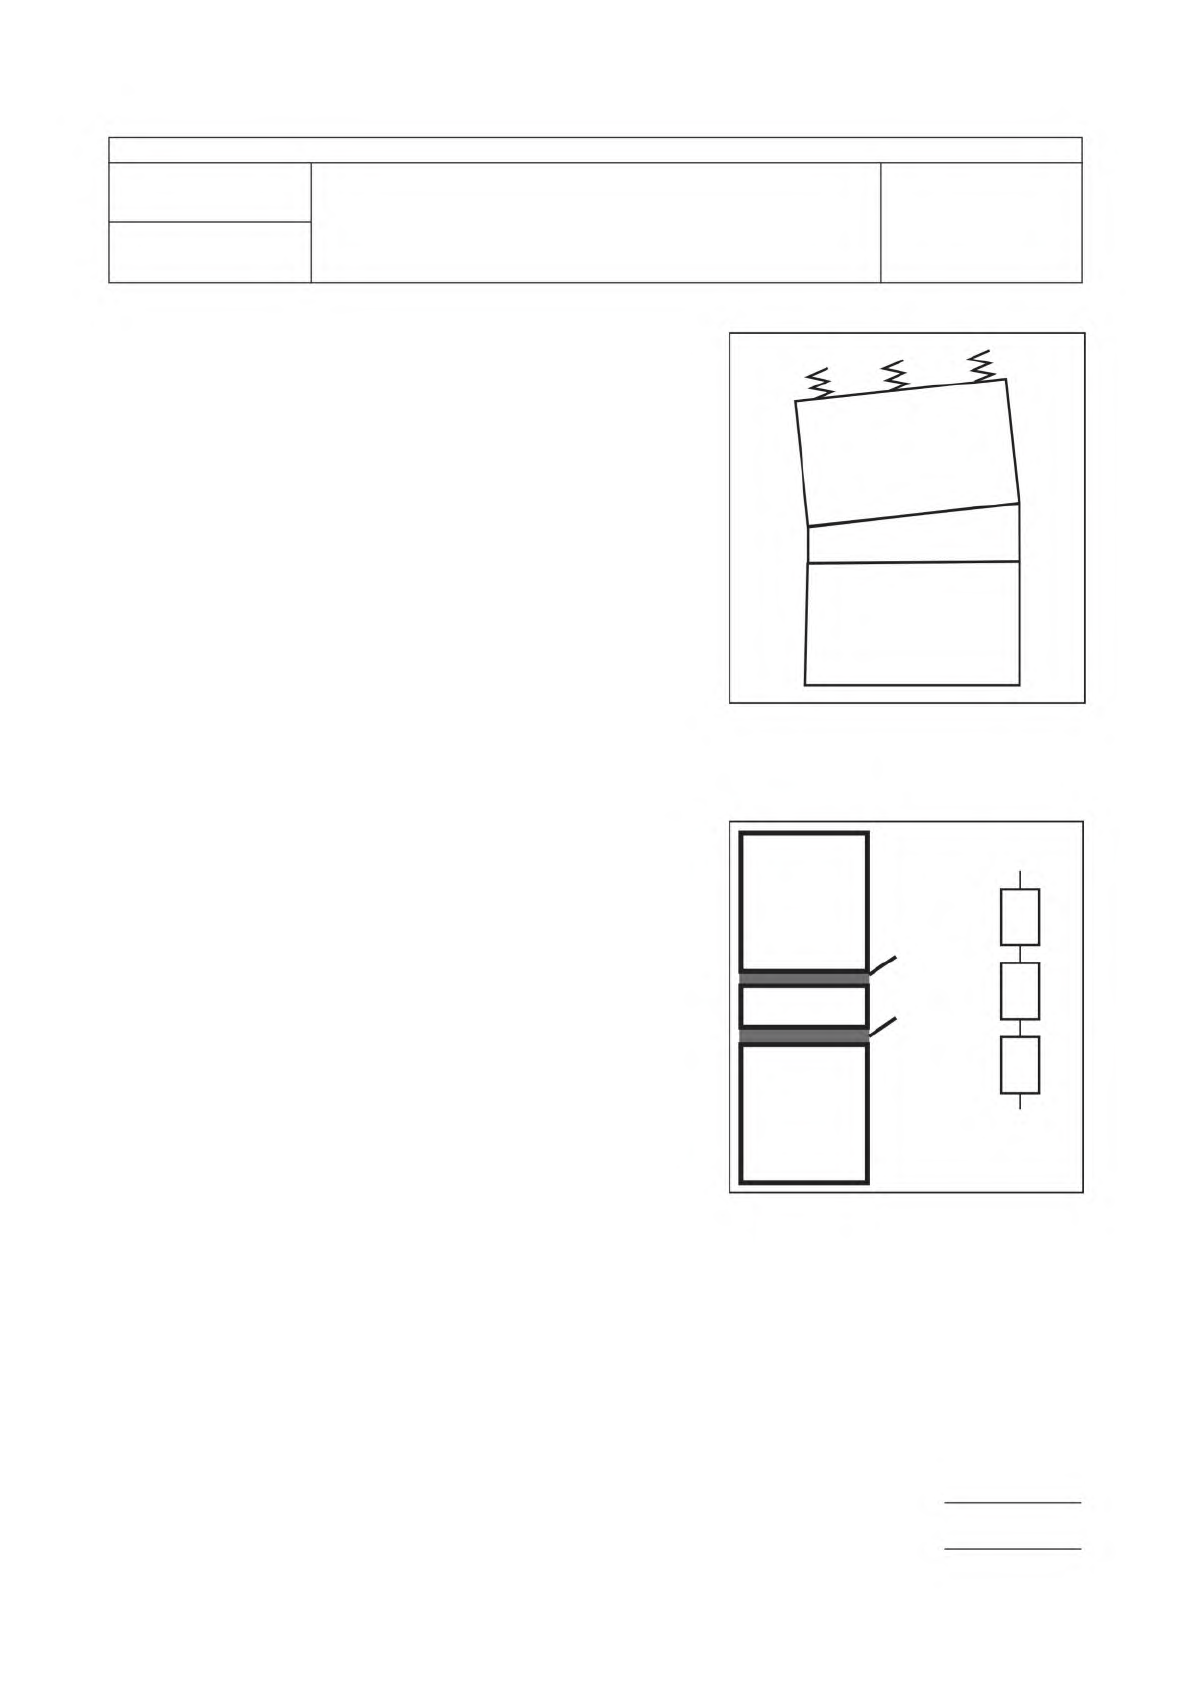
Figure3ElementtoMaintainthePlaneParallelismof
theSpecimen
Note1 – Hot Meter Bar
Note2 – Specimen
Note3 – Cold Meter Bar
1
2
4
5
7
6
4
3
Figure4OrderofMaterialsintheMeasuringSection
(incl.theliquid)andSubstituteImageRegardingthe
ThermalResistances
Note1 – Hot Meter Bar
Note2 – Specimen
Note3 – Cold Meter Bar
Note4 – Liquid to Reduce
the Thermal
Contact
Resistances
Note5 – R
th,liquid
Note6 – R
th,specimen
Note7 – R
th,liquid
IPC-TM-650
Number Subject Date
Revision
Page 6 of 7
2.4.54
TestMethodforThermalTransmissionPropertiesof
09/2022
MetalBasedPrintedBoards(MBPB)
N/A
Equation 14). With the thickness from the microsection it is possible
to calculate the apparent thermal conductivity of the dielectric
layer (Table 1 Equation 16). This calculated value must be shown
in the measurement report including the dimensions (mm²K/W)
(Table 1 Equation 15) as well as the apparent thermal conductivity
in W/(mK) (Table 1 Equation 16) and the thicknesses in µm.
5.10
Measure three identical samples across the board and list
all results in the measurement report. In addition, the mean value
and the standard deviation must be listed as well in the report.
5.11
To measure the DIE thickness a cross section according to
IPC-TM-650 Test Method 2.1.1 should to be made.
5.12
To embed the sample, the specimen is first cut in half using
a e.g., metal saw. Afterwards the specimen gets embedded,
grinded and polished.
5.13
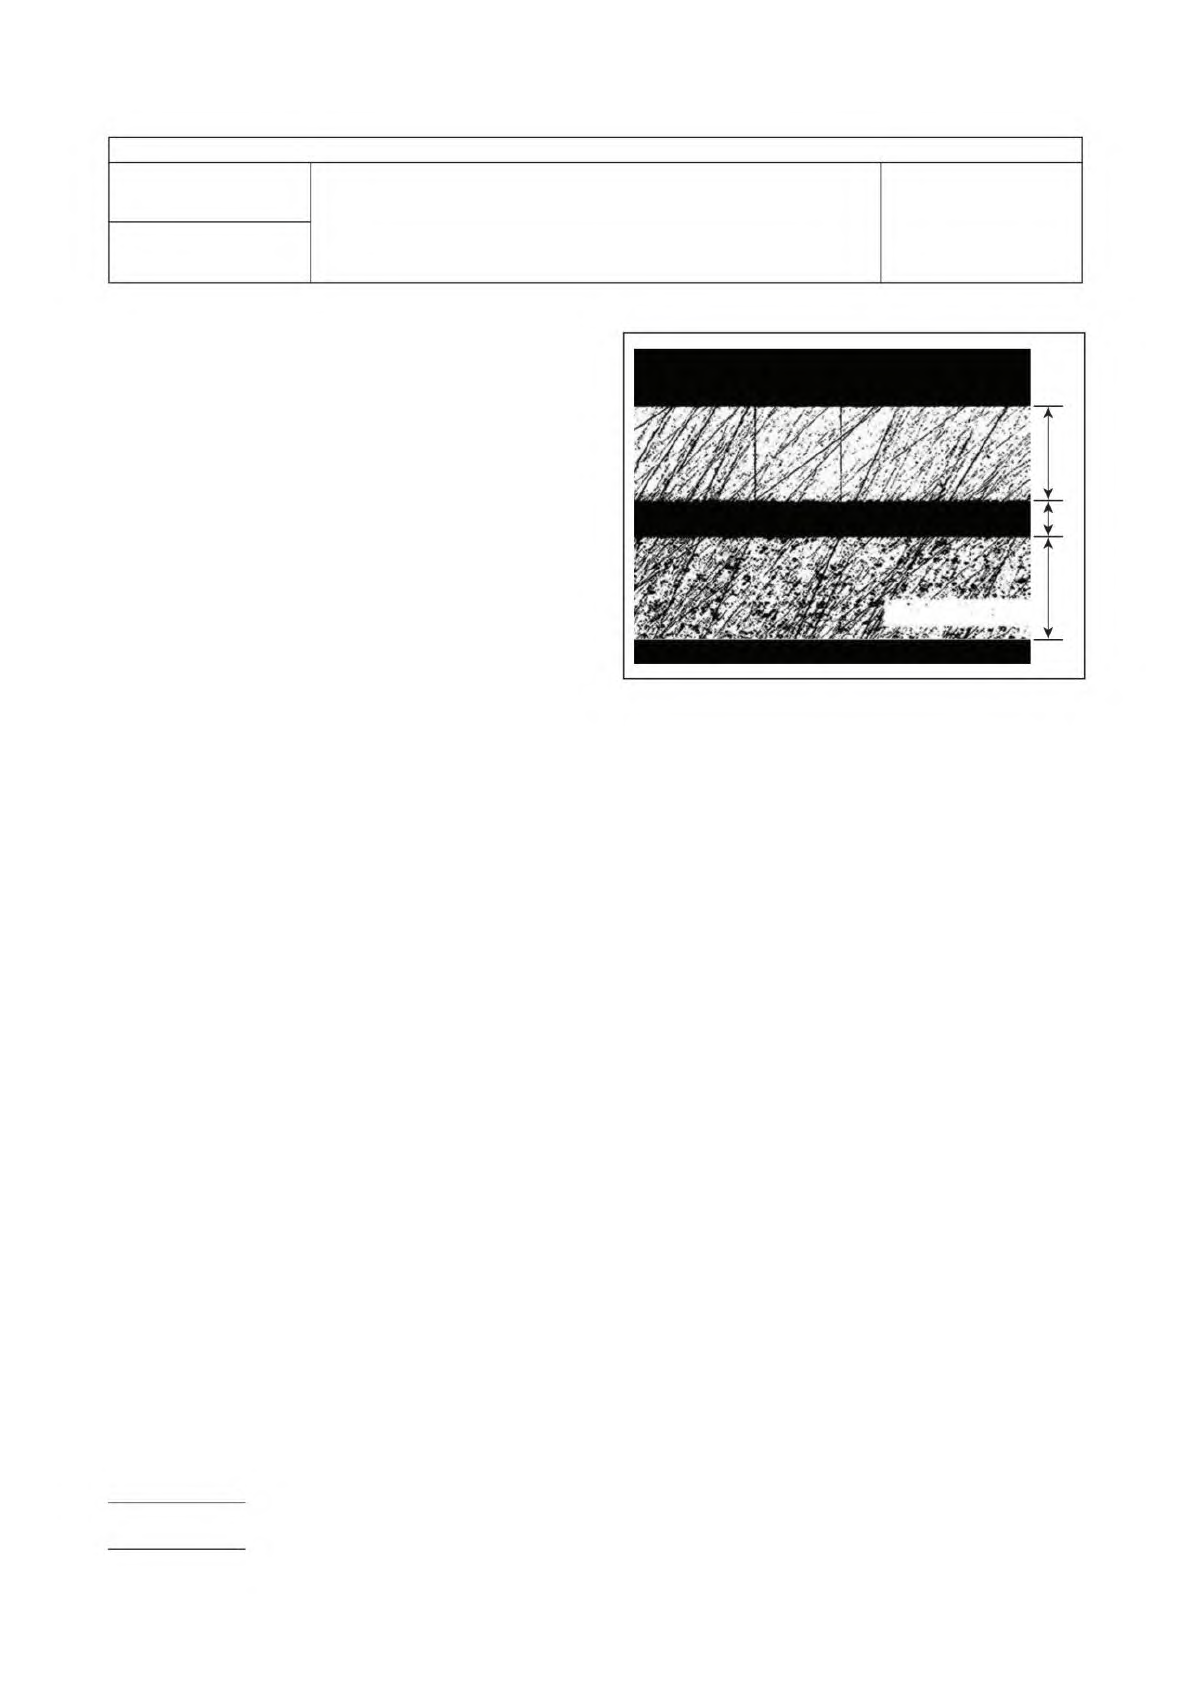
The thicknesses of the top and dielectric layer are measured
in the microsection on five different points using a microscope.
Calculate the middle value of the five measured values for each
layer. From the total thickness of the sample, the thickness of
the base layer can be determined by subtraction (see Table 1
Equation 17).
1
2
3
Figure5LayerStructureofaMetal-BasedBoard
Note1: Top layer: d
top,
see 1.3.1
Note2: Dielectric layer: d
die
Note3: Base layer: d
base

The transfer standard have precision coax connectors
that match the test cables and probes. The uncertainty in the
nominal characteristic impedance of the transfer standards
be less than or equal to ± 0.015 Z
ref
, where Z
ref
is the
characteristic impedance of the transfer standard (nominally
50 Ω.)
4.3.7 Check Standards
The method makes use of two
precision coaxial air lines of two different lengths to verify the
operation of a test set-up (see 5.2.1.2). The air lines are pre-
cision coaxial lines where the center conductors are held in
place with an isolation bead or the center pins of the end
connectors, and are not filled with any other dielectric mate-
rial. The coaxial air lines serve as a precise delay standard that
can be measured during field checks (see 5.2.1.2) to verify the
measurement set-up. The coaxial air line standards are avail-
able commercially with any of the precision coaxial connec-
tors. Probe contact to coaxial transitions must be fabricated
to use with a given probe tip configuration.
5 Procedures
In TDR, the observed voltage waveform is
the sum of incident and reflected signals. The reflections are
related to the difference between the characteristic imped-
ance Z
0
of a transmission line and any impedance discontinui-
ties along the transmission line or at its end.
The method procedures establish the means of determining a
time delay per unit length t
d
from TDR measurements of two
transmission lines that differ in length. The transmission lines
are the interconnect test structures fabricated in PB materials
as specified. The far end of the transmission line is either
electrically open- or short-circuited in order to create a clearly
observable reflection feature in the measured TDR waveform.
The procedures in this section establish the propagation delay
per unit length as the differential propagation time obtained
using the TDR measurements of two interconnect test lines
divided by the length of the same interconnects:
t
d
= t
p
/ 2L
p
Here, t
p
is the measured propagation time difference given by
t
p
=
?
t
T1
− t
T2
?
,
where t
T1
is the round-trip propagation time for the first trans-
mission line and t
T2
is the round-trip propagation time of the
second transmission line.
L
p
is the propagation length difference of the transmission line
pair given by
L
p
=
?
L
T1
− L
T2
?
,
where L
T1
is the length of the first transmission line and L
T2
is
the length of the second transmission line.
5.1 Measurement Preliminaries
This section provides
common considerations for the calibration and initial configu-
ration of the TDR measurement system, and the method to
establish the waveform epoch (time window) used in the delay
measurements (see 5.2 and 5.3).
5.1.1 System Calibrations
5.1.1.1 Manufacturer Calibrations
The TDR oscilloscope
or other TDR equipment used
be calibrated and ser-
viced following the recommended schedule of the instrument
manufacturers.
5.1.1.2 Field Calibrations
Manufacturer ecommended
field calibrations
be performed in addition to scheduled
factory calibrations. TDR system field calibrations
be
performed at the frequency recommended by the instrument
manufacturers and after a change of any system component,
such as a sampler of TDR source unit. The user must ensure
adequate system warm-up time before performing field cali-
brations, as specified by the instrument manufacturers.
Users-accessible field calibrations for TDR oscilloscopes may
include the application of an internal voltage calibration for
each sampler and TDR source. Though not required for this
method, TDR field calibrations may also include a reflection
coefficient or impedance normalization/calibration procedure
where standards are connected to the instrument’s test port
following a menu-driven procedure. Field calibrations are
required for the following reasons:
a. TDR instrument specifications vary with temperature
b. TDR instrument specifications vary with time (drift)
c. TDR instrument specifications vary due to minor ESD dam-
age
d. TDR instrument factory calibration usually does not include
user supplied auxiliary components (i.e., cables, probes,
etc.)
Number
2.5.5.11
Subject
Propagation Delay of Lines on Printed Boards by TDR
Date
04/2009
Revision
IPC-TM-650
shall
shall
shall
shall
Page
8
of
16