MR8740T_Quick guide_eng_20191016H.pdf - 第74页
68 Setting Measurement Conditions 3.2 Setting Measurement Conditions Set conditions required for measurement, such as the sampling rate and recording length. > [Status] > [Condition] 1 2 1 Click the [Sampling] box,…
67
3
Measurement Method
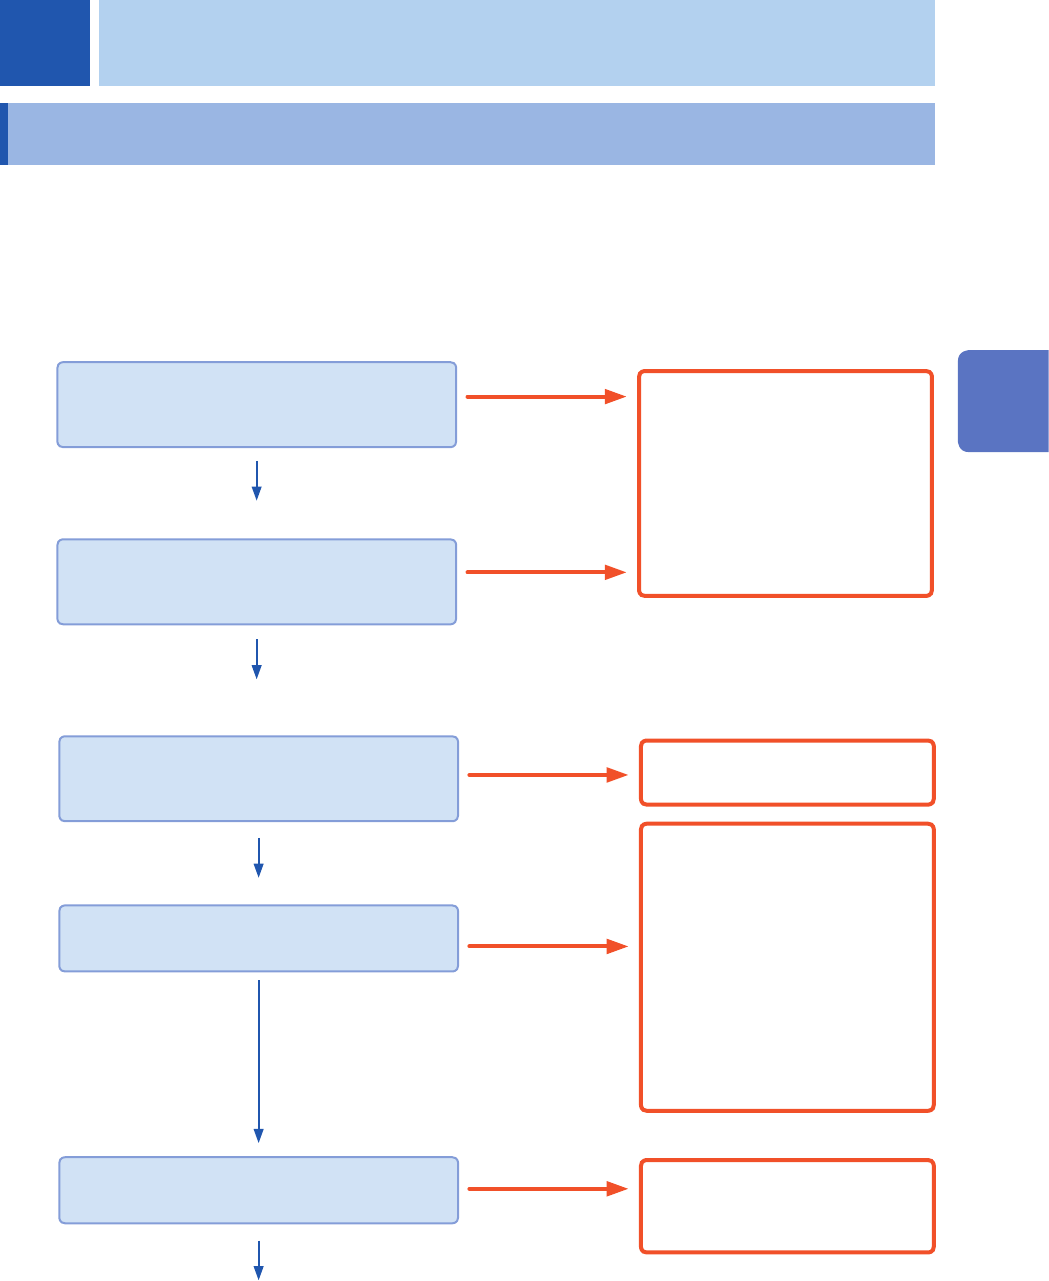
3.1 Inspection Before Measurement
Check if there is any damage to the instrument occurred during storage or shipping and verify that
it operates normally before using the instrument. If you nd any damage, contact your authorized
Hioki distributor or reseller.
Inspecting peripheral devices
When using probes and connecting cords
Is the insulation of each probe of each cord
damaged?
Is the metal part exposed?
Yes
Do not use them because it may
cause an electric shock.
Send instrument for repair.
When using a current sensor
Does the current sensor (jaw) have a crack or
damage?
Yes
No
No
Inspecting the instrument and modules
Are the instrument and modules damaged?
Yes
Send instrument for repair.
No
When turning on the instrument
Does Windows
®
splash screen appear on the
screen?
Yes
Does the screen display waveforms?
Yes
No
• The power cord may have a
brake or the internal circuit of
the instrument may have failed.
Send the instrument for repair.
• Make sure that the monitor is
turned on and the connection
cable is correctly attached.
If
using another monitor and cable
cannot solve the problem, the
instrument may fail. Send the
instrument for repair.
Nothing appears.
An incorrect screen
appears.
The internal circuit of the
instrument may fail. Send the
instrument for repair.
The inspection is completed.
3 Measurement Method
3
Measurement Method
68
Setting Measurement Conditions
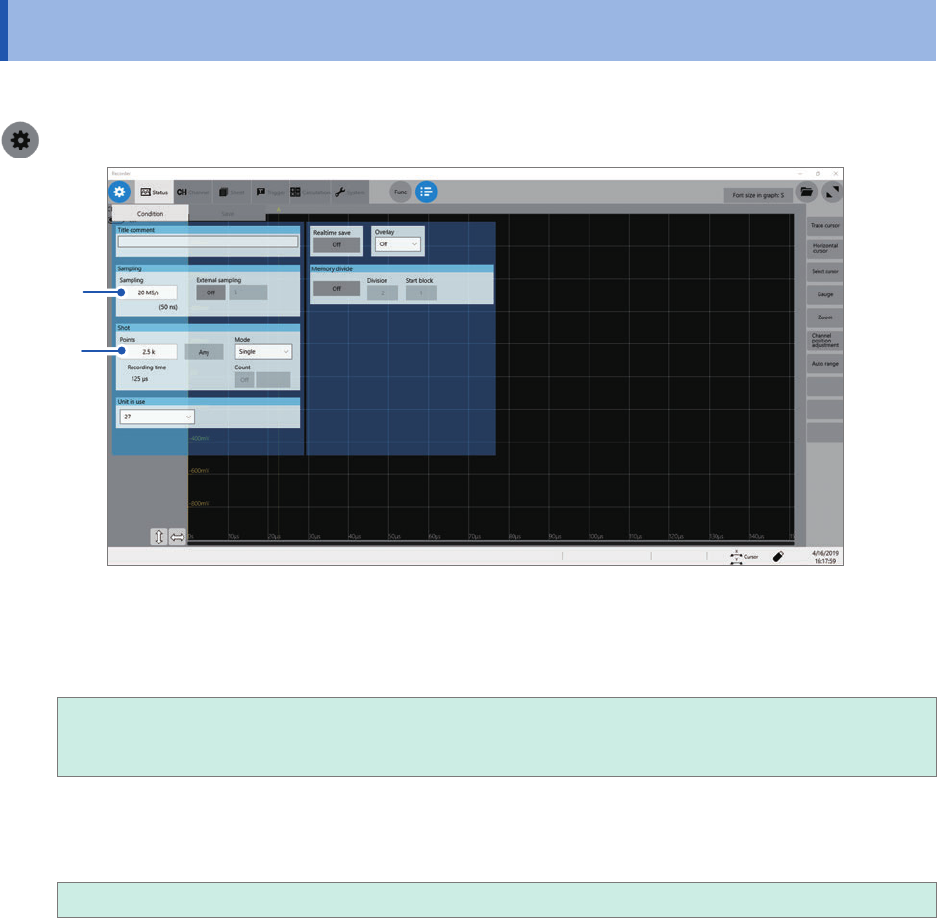
3.2 Setting Measurement Conditions
Set conditions required for measurement, such as the sampling rate and recording length.
> [Status] > [Condition]
1
2
1
Click the [Sampling] box, and then choose a sampling rate from the list.
Refer to “Sampling rate setting guideline” (p. 69).
20 MS/s, 10 MS/s, 5 MS/s, 2 MS/s, 1 MS/s
500 kS/s, 200 kS/s, 100 kS/s, 50 kS/s, 20 kS/s, 10 kS/s, 5 kS/s, 2 kS/s, 1 kS/s,
500 S/s, 200 S/s, 100 S/s, 50 S/s, 20 S/s, 10 S/s, 5 S/s, 2 S/s, 1 S/s
2
Click the [Points] box, and then choose an option for the number of points to be measured
from the list.
2.5 k
, 5 k, 10 k, 20 k, 50 k, 100 k, 200 k, 500 k, 1 M, 2 M, 5 M, 10 M, 20 M, 50 M, 100 M
69
Setting Measurement Conditions
Sampling rate setting guideline
Choose a sampling rate using the following table as a guideline.
Maximum display
frequency
Sampling rate
Maximum display
frequency
Sampling rate
800 kHz 20 MS/s 80 Hz 2 kS/s
400 kHz 10 MS/s 40 Hz 1 kS/s
200 kHz 5 MS/s 20 Hz 500 S/s
80 kHz 2 MS/s 8 Hz 200 S/s
40 kHz 1 MS/s 4 Hz 100 S/s
20 kHz 500 kS/s 2 Hz 50 S/s
8 kHz 200 kS/s 0.8 Hz 20 S/s
4 kHz 100 kS/s 0.4 Hz 10 S/s
2 kHz 50 kS/s 0.2 Hz 5 S/s
800 Hz 20 kS/s 0.08 Hz 2 S/s
400 Hz 10 kS/s 0.04 Hz 1 S/s
200 Hz 5 kS/s
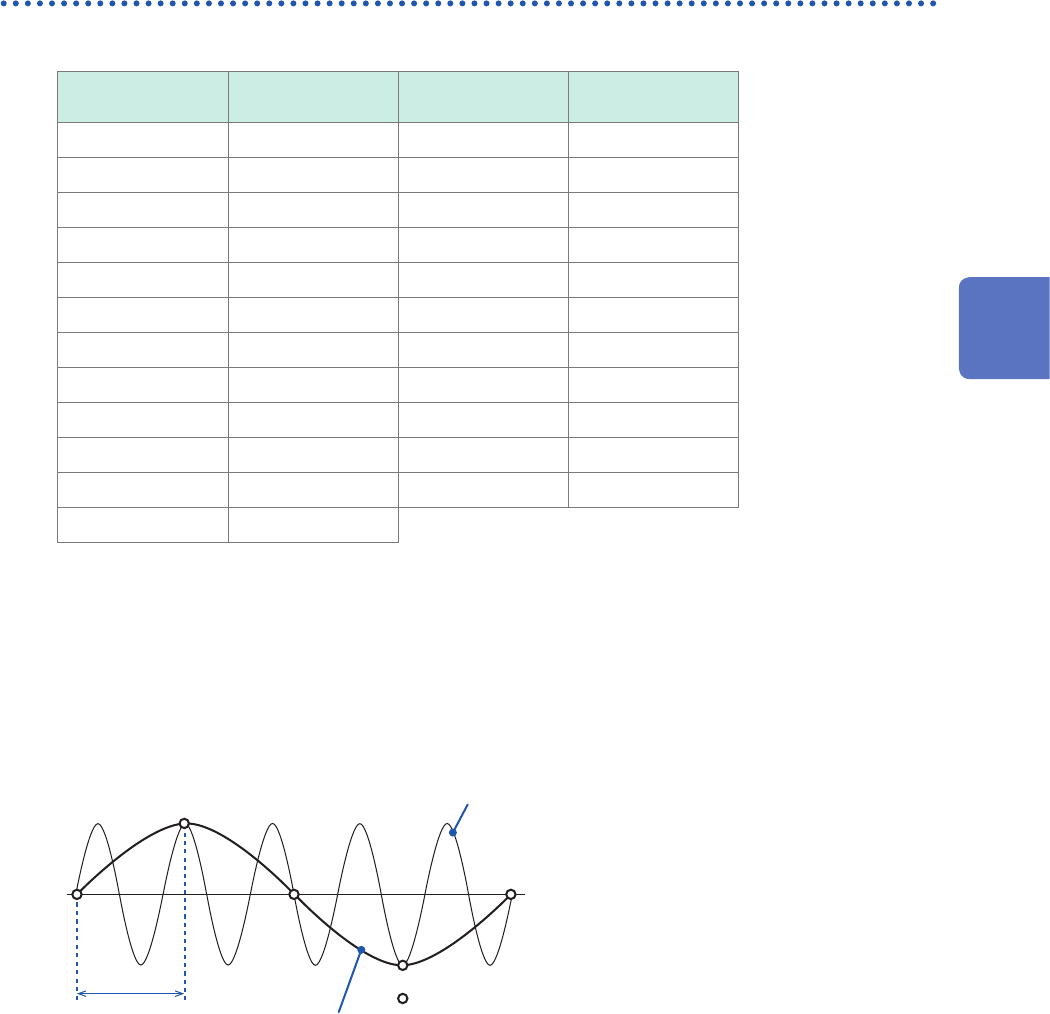
If the instrument plots false waveforms (aliasing)
If a measured signal oscillates at a higher frequency compared to the sampling rate, you chose the
instrument may plot a false waveform oscillating at a frequency lower than that of the actual signal
once the signal frequency reaches a certain level. This phenomenon is called aliasing.
Actual input
signal
Sampling interval
: Sampled points
Observed
waveform
A sampling interval longer than the cycle of the
input signal causes aliasing.
To plot a sign wave that allows you to observe the peaks without any aliasing, the instrument needs
to sample the waveform at a minimum of 25 points per cycle.
To set the sampling rate automatically
Refer to “3.7 Measuring Signals With the Auto-range Setting” (p. 78).
3
Measurement Method