MR8740T_Quick guide_eng_20191016H.pdf - 第88页
82 Reading Measured V alues (T race Cursors) 4 Reading measured values Click [ ] , and then choose [T race Cur .] from the drop-down list. 4 5 Choose two cursors to be displayed from among [T race cursor A] through [T ra…
81
4
Analysis Method
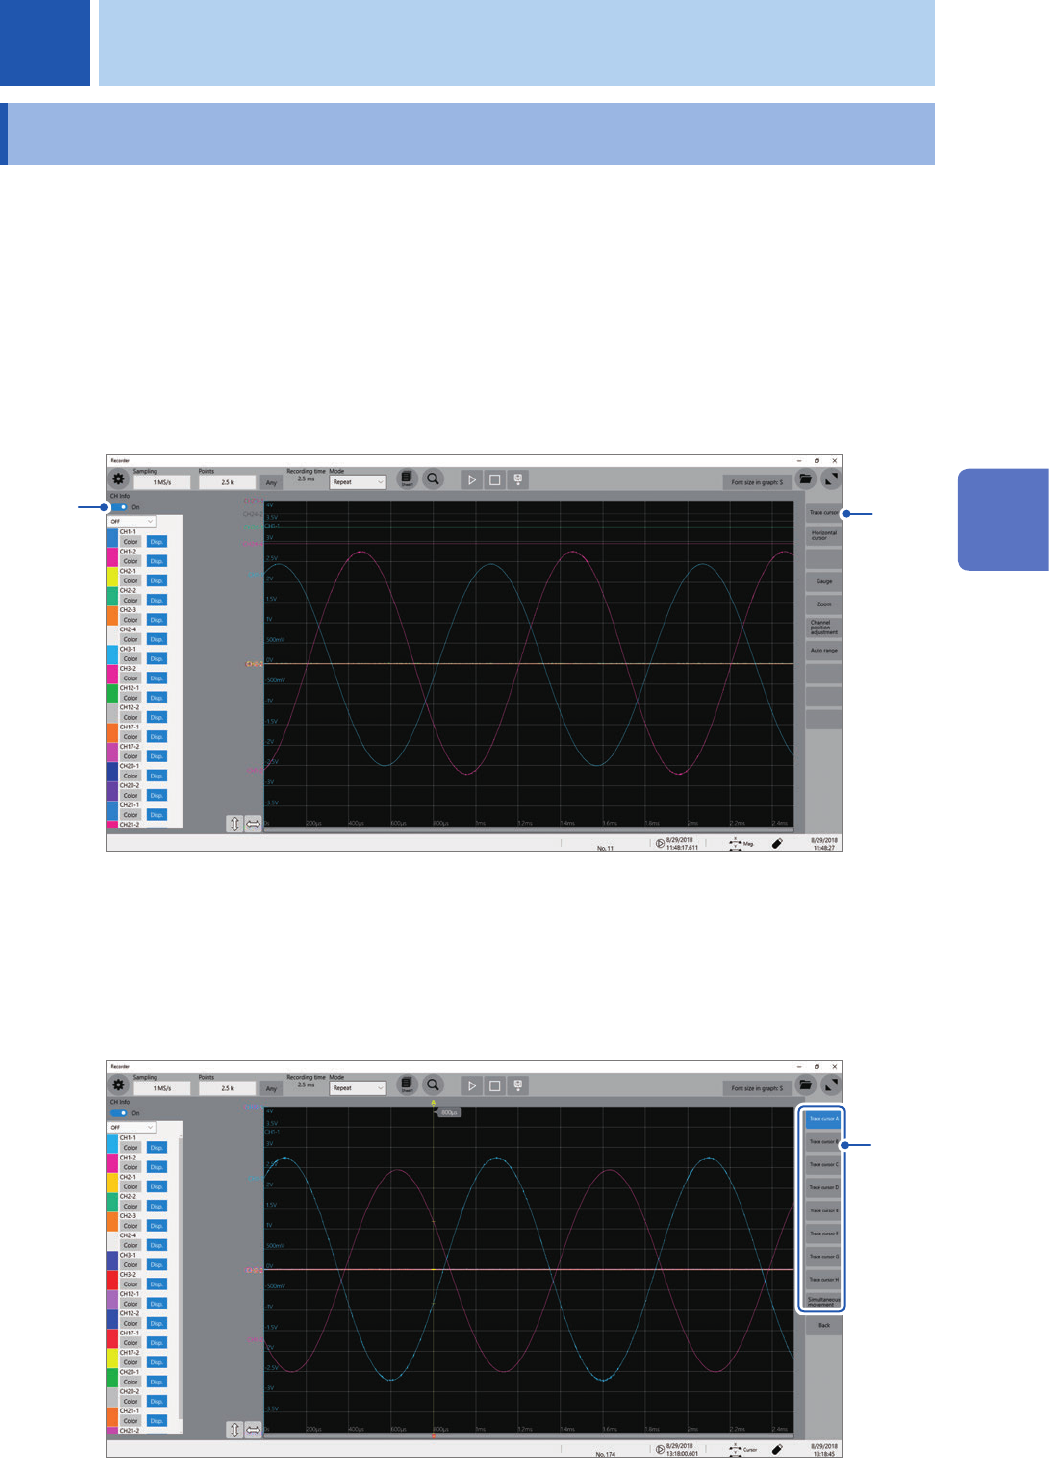
4.1 Reading Measured Values (Trace Cursors)
You can read measured values (scaled values when the scaling is used) using trace cursors on the
waveform screen. The instrument can simultaneously display up to eight trace cursors. You can
read differences in times and measured values between any two cursors you choose from among
all cursors.
For information about other types of cursors than the trace cursor, refer to “2 Operating the
Waveform Screen and Analyzing Data” in Instruction Manual.
1
Set [CH Info] toggle switch to [On].
Click [CH Info] toggle switch to switch between [On] and [Off] for the information display setting of each
channel.
1
2
2
Click [Trace cursor].
3
Choose one or more cursors to be displayed from among
[Trace cursor A]
through
[Trace
cursor H]
by tapping them.
The chosen trace cursors are displayed on the waveform screen.
Drag the trace cursors on the waveform screen to move them.
3
4 Analysis Method
4
Analysis Method
82
Reading Measured Values (Trace Cursors)
4
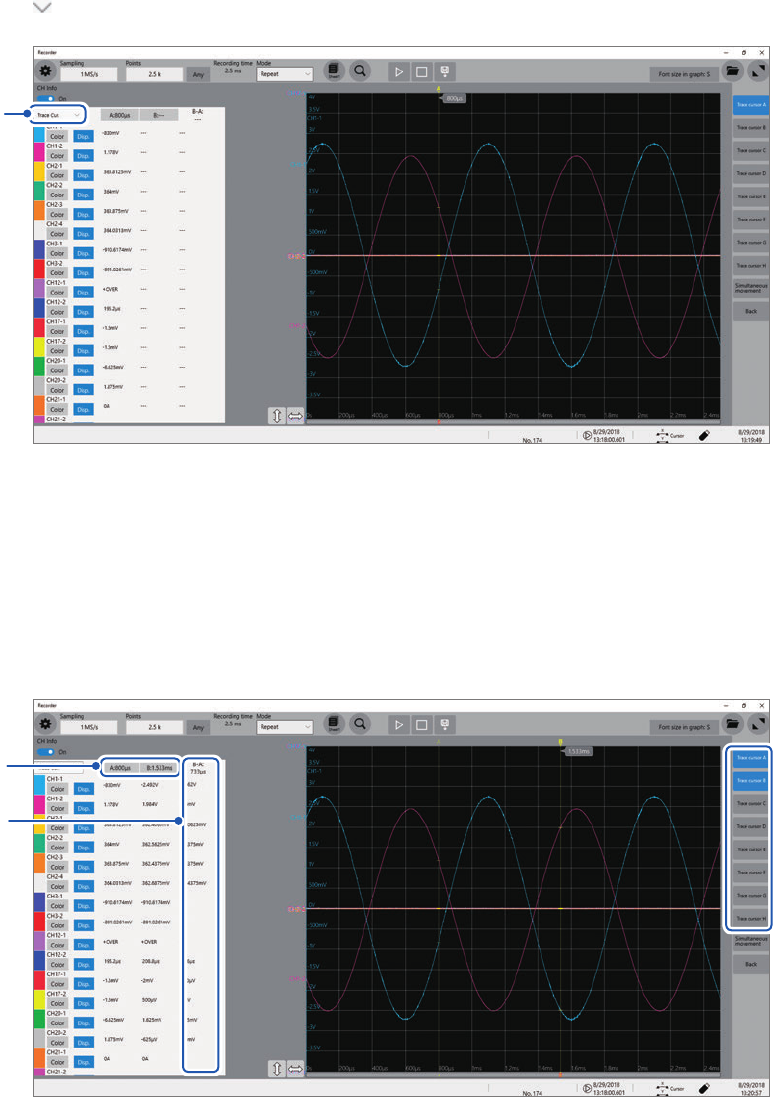
Reading measured values
Click [
], and then choose [Trace Cur.] from the drop-down list.
4
5
Choose two cursors to be displayed from among [Trace cursor A] through [Trace cursor H]
by tapping them.
(Default setting: [Trace cursor A], [Trace cursor B])
The instrument displays differences between cursors you choose in
a
.
If you select a trace cursor other than the one selected in step
3
, the instrument displays the strings [---] in
the difference eld.
5
a
83
Handling Waveforms
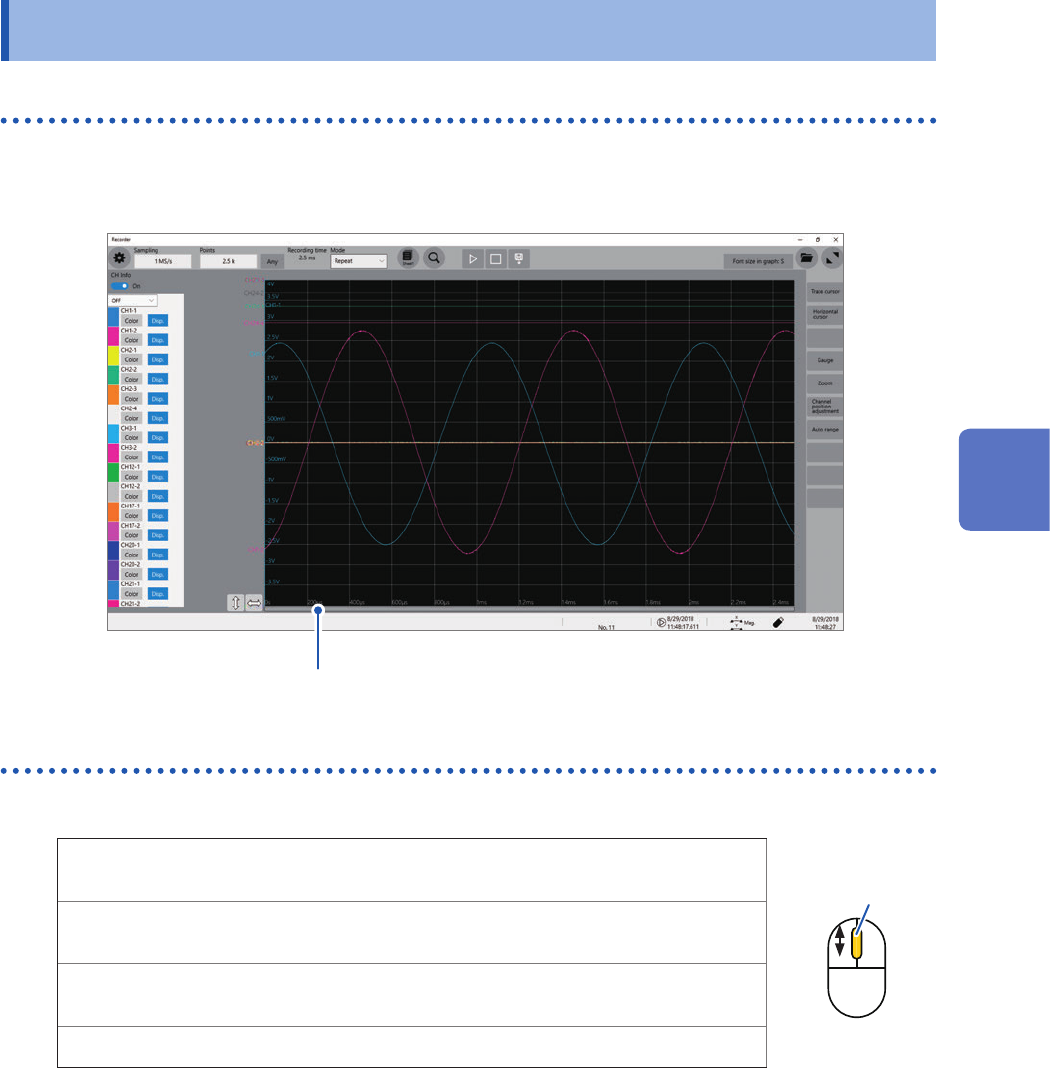
4.2 Handling Waveforms
Scrolling through waveforms
You can use the scroll bar to check the position of waveforms presently displayed on the waveform.
Drag the scroll bar to scroll through the waveforms.
Scroll bar
Zooming in and out waveforms
Point to a specied point and rotate the wheel button to zoom in or out waveforms.
Vertical
axis
Point to a vertical scale (gauge) and rotate the wheel button.
Wheel button
Horizontal
axis
Point to a time axis value and rotate the wheel button.
Vertical
axis
Rotate the wheel button while holding down the Shift key.
Time axis Rotate the wheel button while holding down the Ctrl key.
4
Analysis Method