MR8740T_Quick guide_eng_20191016H.pdf - 第75页
69 Setting Measurement Conditions Sampling rate setting guideline Choose a sampling rate using the following table as a guideline. Maximum display frequency Sampling rate Maximum display frequency Sampling rate 800 kHz 2…
68
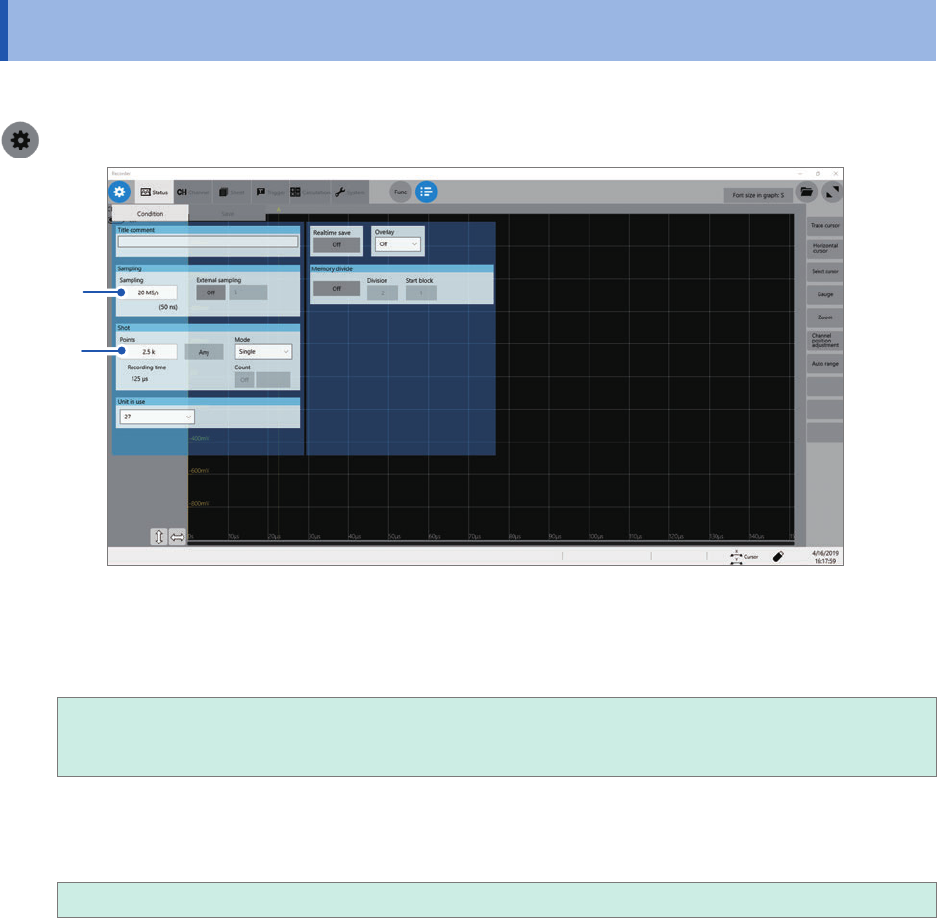
Setting Measurement Conditions
3.2 Setting Measurement Conditions
Set conditions required for measurement, such as the sampling rate and recording length.
> [Status] > [Condition]
1
2
1
Click the [Sampling] box, and then choose a sampling rate from the list.
Refer to “Sampling rate setting guideline” (p. 69).
20 MS/s, 10 MS/s, 5 MS/s, 2 MS/s, 1 MS/s
500 kS/s, 200 kS/s, 100 kS/s, 50 kS/s, 20 kS/s, 10 kS/s, 5 kS/s, 2 kS/s, 1 kS/s,
500 S/s, 200 S/s, 100 S/s, 50 S/s, 20 S/s, 10 S/s, 5 S/s, 2 S/s, 1 S/s
2
Click the [Points] box, and then choose an option for the number of points to be measured
from the list.
2.5 k
, 5 k, 10 k, 20 k, 50 k, 100 k, 200 k, 500 k, 1 M, 2 M, 5 M, 10 M, 20 M, 50 M, 100 M
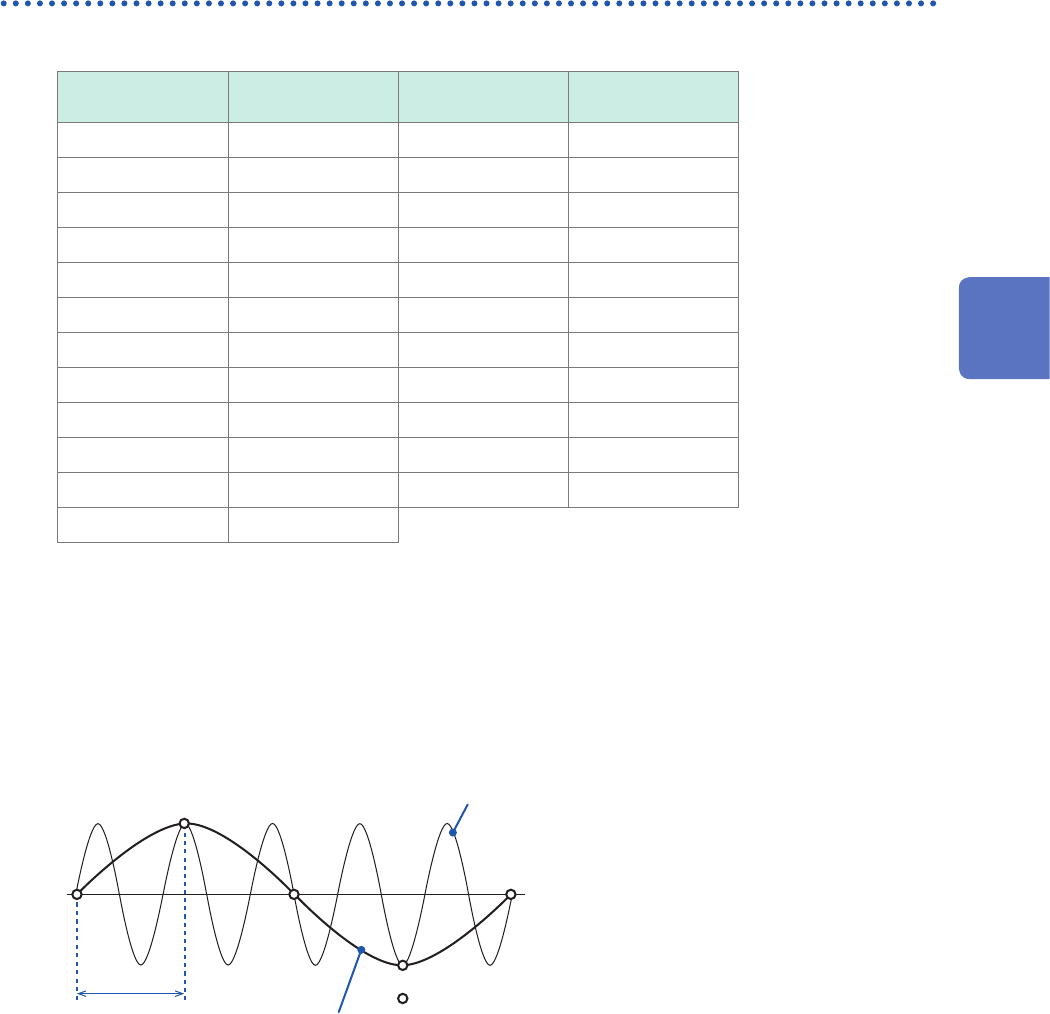
69
Setting Measurement Conditions
Sampling rate setting guideline
Choose a sampling rate using the following table as a guideline.
Maximum display
frequency
Sampling rate
Maximum display
frequency
Sampling rate
800 kHz 20 MS/s 80 Hz 2 kS/s
400 kHz 10 MS/s 40 Hz 1 kS/s
200 kHz 5 MS/s 20 Hz 500 S/s
80 kHz 2 MS/s 8 Hz 200 S/s
40 kHz 1 MS/s 4 Hz 100 S/s
20 kHz 500 kS/s 2 Hz 50 S/s
8 kHz 200 kS/s 0.8 Hz 20 S/s
4 kHz 100 kS/s 0.4 Hz 10 S/s
2 kHz 50 kS/s 0.2 Hz 5 S/s
800 Hz 20 kS/s 0.08 Hz 2 S/s
400 Hz 10 kS/s 0.04 Hz 1 S/s
200 Hz 5 kS/s
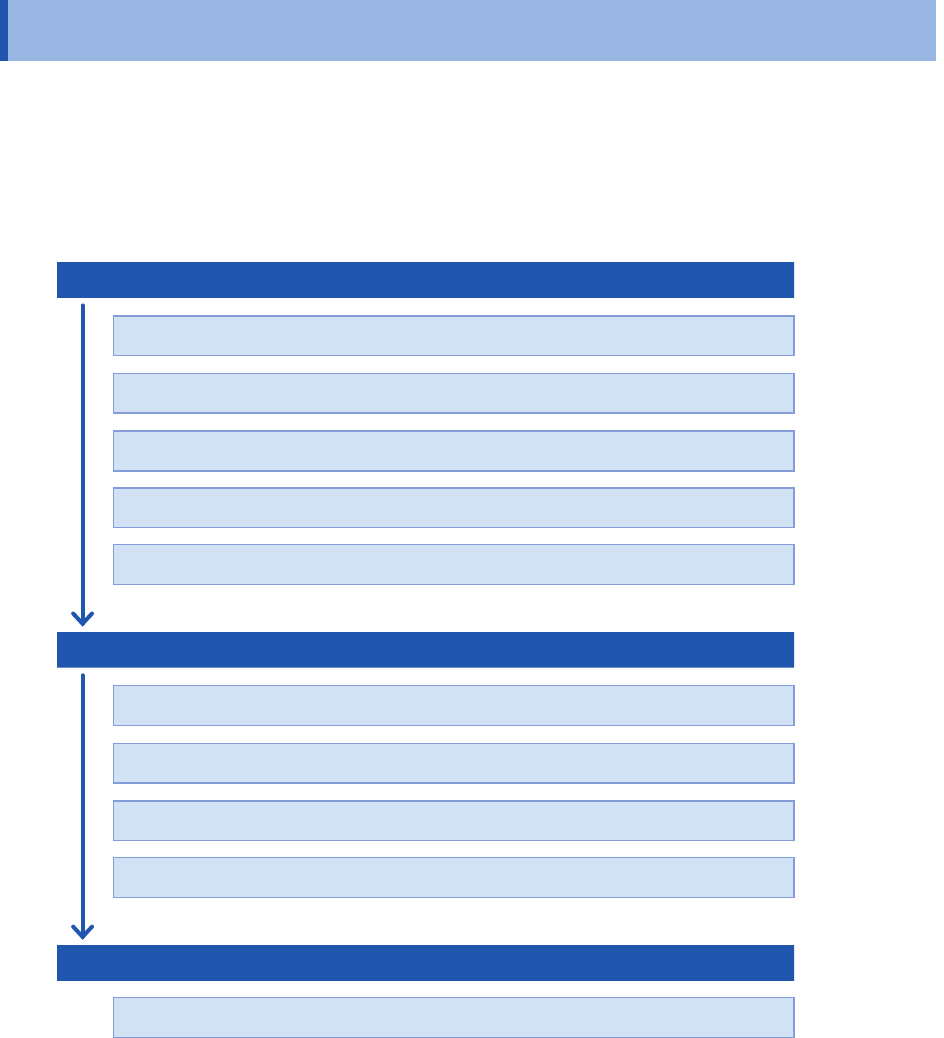
If the instrument plots false waveforms (aliasing)
If a measured signal oscillates at a higher frequency compared to the sampling rate, you chose the
instrument may plot a false waveform oscillating at a frequency lower than that of the actual signal
once the signal frequency reaches a certain level. This phenomenon is called aliasing.
Actual input
signal
Sampling interval
: Sampled points
Observed
waveform
A sampling interval longer than the cycle of the
input signal causes aliasing.
To plot a sign wave that allows you to observe the peaks without any aliasing, the instrument needs
to sample the waveform at a minimum of 25 points per cycle.
To set the sampling rate automatically
Refer to “3.7 Measuring Signals With the Auto-range Setting” (p. 78).
3
Measurement Method
70
Conguring the Input Channel settings
3.3 Conguring the Input Channel settings
Congure the analog channel settings.
Channel setting procedure
This section describes how to congure the analog channel (CH1-1 through CH27-4) settings. For
details of analog channels such as a setting of each module, refer to
“1.3 Specifying Input Channel
Settings”
of the Instruction Manual.
Conguring the input settings
Choose a measurement mode.
Choose a measurement range for each measuring object.
Choose an input coupling method.
Choose a low-pass lter cutoff frequency (if noise is present).
Congure each module settings (as required).
Conguring the display settings
Select waveform colors.
Choose a display position and magnication ratio (as required).
Fine-adjust waveform amplitude (vernier function).
Convert input values. (scaling function)
Conguring the trigger settings (as required)
Congure the level trigger settings.
• When the input coupling method is set to GND, the instrument measures the ground potential in
the module; thus, it does not measure any input waveforms.
• An inuence of the lter attenuation may prevent the instrument from setting an appropriate
range.